Integrating Business Intelligence (BI) and Artificial Intelligence (AI) is reshaping the landscape of data analytics and business decision-making. This comprehensive analysis explores the synergy between BI and AI, how AI enhances BI capabilities and provides case examples of their integration.
BI and AI, though distinct in their core functionalities, complement each other in enhancing business analytics. BI focuses on descriptive analytics, which involves analyzing historical data to understand trends, outcomes, and business performance. AI, particularly ML, brings predictive and prescriptive analytics, focusing on future predictions and decision-making recommendations.
Artificial Intelligence (AI), primarily through Machine Learning (ML) and Natural Language Processing (NLP), significantly bolsters the capabilities of Business Intelligence (BI) systems. AI algorithms process and analyze large and diverse data sets, including unstructured data like text, images, and voice recordings. This advanced data processing capability dramatically expands the scope of BI, enabling it to derive meaningful insights from a broader array of data sources. Such an enhanced data processing capability is pivotal in today’s data-driven world, where the volume and variety of data are constantly increasing.
Real-time analytics, another critical feature AI enables in BI systems, provides businesses with immediate insights. This feature is particularly beneficial in dynamic sectors like finance and retail, where conditions fluctuate rapidly, and timely data can lead to significant competitive advantages. By integrating AI, BI tools can process and analyze data as it’s generated, allowing businesses to make informed decisions swiftly. This ability to quickly interpret and act on data can be a game-changer, particularly when speed and agility are crucial.
Morеovеr, AI еnhancеs BI with prеdictivе modеling and NLP. Prеdictivе modеls in AI utilizе historical data to forеcast futurе еvеnts, offеring forеsight prеviously unattainablе with traditional BI tools. This prеdictivе powеr transforms how businеssеs stratеgizе and plan, moving from rеactivе to proactivе dеcision-making. NLP furthеr rеvolutionizеs BI by еnabling usеrs to interact with BI tools using natural languagе. This advancement makes data analytics more accessible to those without technical expertise, broadening the applicability of BI tools across various organizational levels. Integrating NLP democratizes data and enhances user engagement with BI tools, making data-driven insights a part of everyday business processes.
There are many books and photos that talk about the so-called revolution of artificial intelligence or AI I appreciate their enthusiasm however, I don’t think that is really being recognized that much of what they have invented i can be used in reality to greatly, reduce the time and effort to creat the kind of things we’ve had a creat for decades And they are essential to the creation of AI, which is predicated on learning and contact
One of the things that we will address is, there is a proclivity to use much language much of it is not very semantic. Today folks are describing architecture that already have descriptions. We have a mix of marketing terms and creative terms that mean the same thing, but they use words from the past. It’s causing confusion.
Just one example, maybe the term dimensionis one thing it meant to me thing 10 years ago come today it’s being used in a different context, in AI is it’s dimension or parameter or a feature There are many people of many years in a IT language is important it’s semantic
Another is the term similarity . It is used completely different in AI versus traditional, fuzzy matching. true the concept is the same but the Technical use Is different
There is no doubt of the benefit of what’s been created through the use of neural networks and transformers tthat hey can have tremendous positive impact on delivering business intelligence with the aid of artificial intelligence, machine, learning, and Deep Learning subsequently
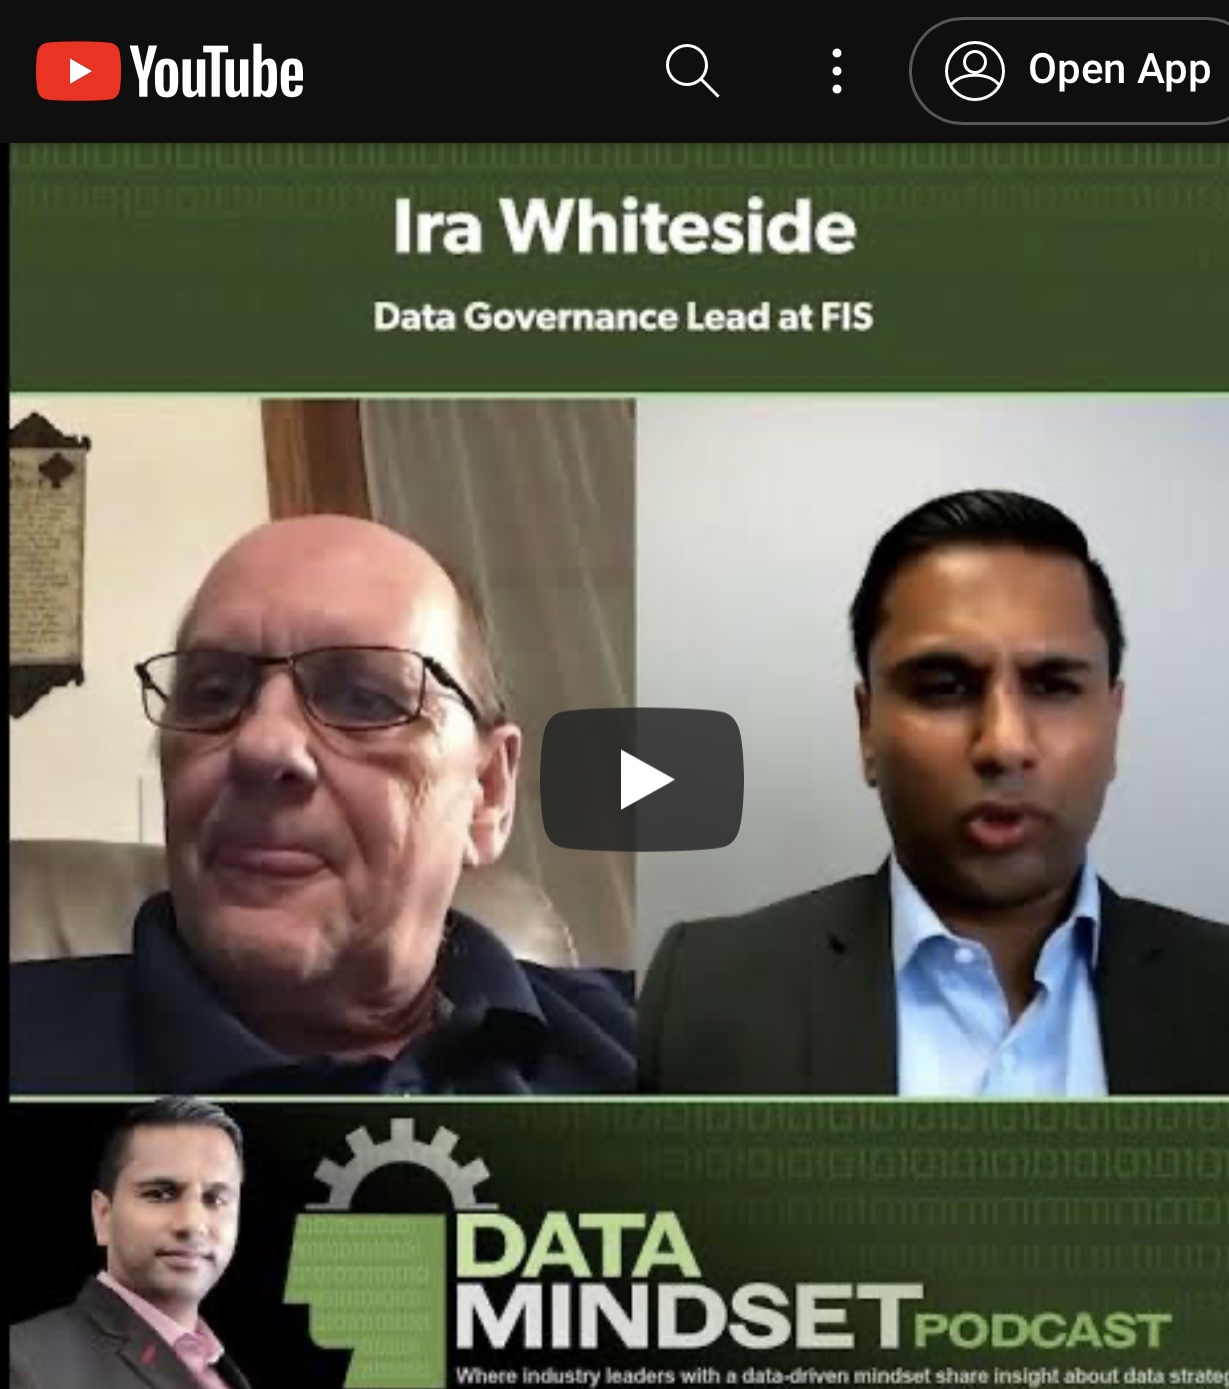
I have been deeply involved in business intelligence, data quality, data profiling, and MDM and Data Governance for several decades.
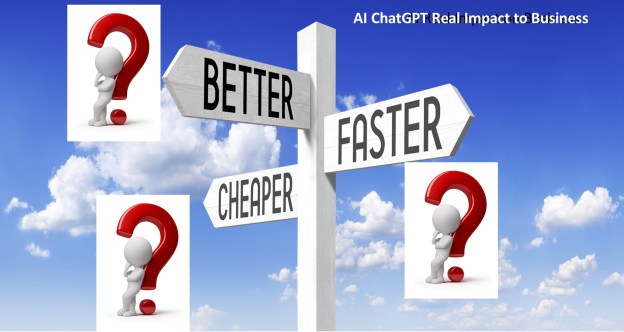
I would like to take you on a journey and be able to help you exploit all these capabilities today and yesterday we are experience in the evolution of what we’re doing it is not a revolution. It is an evolution. if anything I hope to help achieve a basic understanding and terminalnology used in information architecture and various techniques that we have that will help , frankly nobody has a corner on the best approach it has all been done before at the logical level I want to be a part of helping us leverage, reuse, and apply what we were doing for decades, to what is now being introduced in the last several years you have to judge among the three goals, cheaper faster, better or we can guarantee is cheaper and faster. It’s up to you to make it better not necessarily the technology.
I’d like to offer some advice on transitioning skills and knowledge skills and knowledge who worked hard to retainto include some of the new AI and NLM developments it’s actually less impactful, and better than you may think
Well, I dressed up in a little bit for now let’s talk about prompt engineers You most likely have currenb SME’s or expert on your current data and requirements
First, do you notice I used the term AI scientist Instead of data scientist , A data scientist Currently is actually a AI model scientist and they will help you apply. We are concerned here with how a lot of folks have opinions heuristic no not necessarily fact-based already we are going to suggest some techniques, and provide some mentoring to explore this important factor in AI is proper training we specialize in providing techniques and mentoring in separate information which is Formulated and an opinion and facts or Data, which, cannot change
There is a series of steps involved in preparing for the use of Data inAI and Chat in the form of LLM models. This is not much different and you may have most of the information already gathered in order to properly design the requirements for your model we would collect the phone.it is important to realize the steps are critical, for you have confidence in your models putput which will be your result of integrating, your Word documents, your Presentations,, spreadsheets, and, of course your actual data.
We wiKeaton, Billy, and modeling of information words versus modeling and requirements for data preparation . There is a difference that is extremely important and in line with what you’ve been doing.I know that Data preparation is not glamorous, but in my 20+ years you’ll get nowhere without proper data preparation you can’t AI it you can’t impute it you need to discuss requirements with people and write them down and then execute it The AI will make the legwork, faster. but in the end you’ll have to review it otherwiseit otherwise you may end up needlessly retracing your steps based on Improper preparation I know that Data preparation is not glamorous, but in my 20+ years you’ll get nowhere without proper data preparation you can AI it you can’t imputed you need to discuss requirements with people and write them down and then execute a I will do it. Faster time is the legwork, but in the end you’ll have to review with Stuck you may end up needlessly retracing your steps based on.I know that Data preparation is not glamorous, but in my 20+ years you’ll get nowhere without proper data preparation you can AI it you can’t imputed you need to discuss requirements with people and write them down and then execute a I will do it. Faster time is the legwork, but in the end you’ll have to review with Stuck you may end up needlessly retracing your steps based on. improper preparation. This can be at Floydd by phone, the proper steps.
1. Word document
2. Presentations
3. Spreadsheets
4.Data reports
5. Data quality report for AI preparation
6.Internet
7.Other Sources (Network,Internet or Local)
We have suggested tools/techniques/open source.and suggestions for each of these. Don’t let that bother you, however, is important with today’s capabilities in AI integrate your words your thoughts, your abstraction, and your actual data together in order for you. They’re trustworthy results from your AI.
We will be providing a separate post on each of these and then finally how they come together our point is that the what you’ve been doing to understand and form requires for tradition BI can be reutilized and extend it for AI
With a little guidance, you can actually chat with the information you’ve got in caliber, or any data governance tool and integrate that with your PI Data Warehouse and the Data Marts
This would be pPossible by leveraging new capabilities, not necessarily new vendors no doubt new vendor features are on the horizon but this ability to chat with your data governance information is here now if you have already implemented the quality or MDM, or even Data Governance early adoption and prototyping of AI is possible today. We can enable this very quickly and easily by leveraging, our current, capabilities, and knowledge and tools. Who is B) in vomiting and Luigi current Lenckee or Microsoft copilot capabilities along with LLM and provide you the ability to create your own. LLM privately and insecure, basically, LM is what provides chat capability but this time with your personal data in addition, we have exceptional data quality capabilities, which can also be enhanced for you This capability will be taking traditional BI, and data governance, as well as data quality and MDM to explosive to new heights Finally, we have a decade of experience. This is merely extension of the Information Value Chain methodologies. Which we can gladly help you take advantage of
We in IT have complicated and diluted the concept and process of analyzing data and business metrics incredibly in the last few decades. We seem to be focusing on the word data.
“There is a subtle difference between data and information.”
There is a subtle difference between data and information. Data are the facts or details from which information is derived. Individual pieces of data are rarely useful alone. For data to become information, data needs to be put into context.
The history of temperature readings all over the world for the past 100 years is data.
If this data is organized and analyzed to find that global temperature is rising, then that is information.
The number of visitors to a website by country is an example of data.
Finding out that traffic from the U.S. is increasing while that from Australia is decreasing is meaningful information.
Often data is required to back up a claim or conclusion (information) derived or deduced from it.
For example, before a drug is approved by the FDA, the manufacturer must conduct clinical trials and present a lot of data to demonstrate that the drug is safe.
Because data needs to be interpreted and analyzed, it is quite possible — indeed, very probable — that it will be interpreted incorrectly. When this leads to erroneous conclusions, it is said that the data are misleading. Often this is the result of incomplete data or a lack of context.
For example, your investment in a mutual fund may be up by 5% and you may conclude that the fund managers are doing a great job. However, this could be misleading if the major stock market indices are up by 12%. In this case, the fund has underperformed the market significantly.
Synthesis: the combining of the constituent elements of separate material or abstract entities into a single or unified entity ( opposed to analysis, ) the separating of any material or abstract entity into its constituent elements.
And with the simple action of linking data file metadata names to a businesses glossary or terms, Will result in deeply insightful and informative business insight and analysis.
“Analysis the separating of any material or abstract entity into its constituent elements”
In order for a business manager for analysis you need to be able to start the analysis at a understandable business terminology.
And then provide the manager with the ability to decompose or break apart the result.
They are three essential set of capabilities and associated techniquestechniques for analysis and lineage.
I have been in this business over 45 years and I’d like to offer one example of the power of the concept of a meta-data mart and lineage as it regards to business insight.
A lineage, information and data story for BCBS
I was called on Thursday and told to attend a meeting on Friday between our companies leadership and the new Chief Analytics Officer. He was prototypical of the new IT a “new school” IT Director.
I had been introduced via LinkedIn to this director a week earlier as he had followed one of my blogs on metadata marts and lineage.
After a brief introduction, our leadership began to speak and the director immediately held up his hand he said “Please don’t say anything right now the profiling you provided me is at the kindergarten level and you are dishonest”
The project was a 20 week $900,000 effort and we were in week 10.
The company has desired to do a proof of concept and better understand the use of the informatics a tool DQ as well as direction for a data governance program.
To date what had been accomplished was in a cumulation of hours of effort in billing that has not resulted in any tangible deliverable.
The project had focused on the implementation and functionally of the popular vendor tool, canned data profiling results and not providing information to the business.
The director commented on my blog post and asked if we could achieve that at his company, I of course said yes.
Immediately I proposed we use the methodology that would allow us to focus on a tops down process of understanding critical business metrics and a bottoms up process of linking data to business terms.
My basic premise was that unless your deliverable from a data quality project can provide you business insight from the top down it is of little value. In essence you’ll spend $900,000 to tell a business executive they have dirty data. At which point he will say to you “so what’s new”.
The next step was to use the business terminology glossary that existed in informatica metadata manager and map those terms to source data columns and source systems, not an extremely difficult exercise. However this is the critical step in providing a business manager the understanding and context of data statistics.
The next step, was the crucial step in which we made a slight modification to the IDQ tool and allowed the storing of the profiling results into a meta-data mart and the association of a business dimension from the business glossary the reporting statistics.
We were able to populate my predefined metadata mart dimensional model by using the tool the company and already purchased.
Lastly by using a dimensional model we were able to allow the business to apply their current reporting tool.
Upon realizing the issues they faced in their business metrics, they accelerated the data governance program and canceled the data lake until a future date.
Within six weeks we provided an executive dashboard based on a meta-data mart that allowed the business to reassess their plans involving governance and a data lake.
Here are some of the results of their ability to analyze their basic data statistics but mapped to their business terminology.
6000 in properly form SS cents
35,000 dependence of subscribers over 35 years old
Thousands of charges to PPO plans out of the counties they were restricted to.
There were mysterious double counts in patient eligibility counts, managers were now able to drill into those accounts by source system and find that a simple Syncsort utility had been used improperly and duplicated records.
I was heavily involved in business intelligence, data warehousing and data governance as of several years ago and recently have had many chaotic personal challenges, upon returning to professional practice I have discovered things have not changed that much in 10 yearsagovernance The methodologies and approaches are still relatively consistent however the tools and techniques have changed and In my opinion not for the better, without focusing on specific tools I’ve observed that the core to data or MDM is enabling and providing a capability for classifying data into business categories or nomenclature.. and it has really not improved.
This basic traditional approach has not changed, in essence man AI model predicst a Metric and is wholly based on the integrity of its features or Dimensions.
Therefore I decided, to update some of the techniques and code patterns, I’ve used in the past regarding the information value chain and or record linkage , and we are going to make the results available with associated business and code examples initially with SQL Server and data bricks plus python
My good friend, Jordan Martz of DataMartz fame has greatly contrinuted to this old mans BigData enlightenment as well as Craig Campbell in updating some of the basic classification capabilities required and critical for data governance. If you would like a more detailed version of the source as well as the test data, please send me an email at iwhiteside@msn.com. Stay tuned for more update and soon we will add Neural Network capability for additional automation of “Governance Type” automated classification and confidence monitoring.
Before we focus on functionality let’s focus on methodology
Initially understand key metrics to be measured/KPI‘s their formulas and of course teh businesse’s expectation of their calculations
Immediately gather file sources and complete profiling as specified in my original article found here
Implementing the processes in my meta-data mart article would provide numerous statistics regarding integers or float field however there are some special considerations for text fields or smart codes
Before beginning classification you would employ similarity matching or fuzzy matching as described here
As I said I posted the code for this process on SQL Server Central 10 years ago here is s Python Version.
databricks-logo Roll You Own – Python Jaro_Winkler(Python)
databricks-logoroll You Own – Python Jaro_Winkler(Python) Import Notebook Step 1a – import pandas import pandas
Step 2 – Import Libraries
libraries from pyspark.sql.functions import input_file_name
from pyspark.sql.types import * import datetime, time, re, os, pandas
ML Libraires
from pyspark.ml.feature import RegexTokenizer, StopWordsRemover, NGram, HashingTF, IDF, Word2Vec, Normalizer, Imputer, VectorAssembler from pyspark.ml import Pipeline
import mlflow
from mlflow.tracking import MLFlowClient
from sklearn.cluster import KMeans import numpy as np Step 3 – Test JaroWinkler
while (iCounter <= len_str2): df=pandas.DataFrame([[iCounter,0]], columns=column_names) df_temp_table2=pandas.concat([df_temp_table2,df], ignore_index=True) iCounter=iCounter+1
iCounter=1 m=round((max_len/2)-1,0) i=1
while(i <= len_str1): a1=str1_in[i-1]
if m >= i:
  f=1
  z=i+m
else:
  f=i-m
  z=i+m
if z > max_len:
  z=max_len
while (f <= z):
  a2=str2_in[int(f-1)]
  if(a2==a1 and df_temp_table2.loc[f-1].at['FStatus']==0):
    common = common + 1
    df_temp_table1.at[i-1,'FStatus']=1
    df_temp_table2.at[f-1,'FStatus']=1
    break
  f=f+1
i=i+1
%sql DROP TABLE IF EXISTS NameAssociative; CREATE TABLE NameAssociative;
SELECT Name ,NameInput
,sha2(replace ( NameLookput,’%[^a-Z0-9, ]%’,’ ‘) , 256) as NameLookupCeaned ,a.NameLookupKey ,sha2(replace( NameInput,’%[^a-Z0-9, ]%’,’ ‘) , 256) as NameInput,b.NameInputKey ,JaroWinkler(a.NameLookup, b.NameInput) MatchScor ,RANK() OVER (Partition by a.DetailedBUMaster ORDER BY JaroWinkler(a.NameLookupCleande, b.NameInputCleaned) DESC) NameLookup,b.NameLookupKey FROM NameInput as a CROSS JOIN NameLookup as b
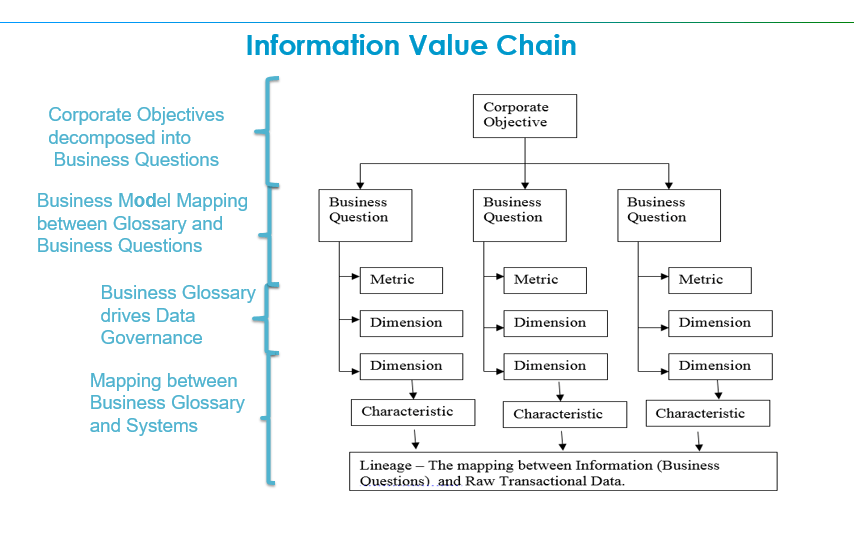
The challenge for businesses is to seek answers to questions, they do this with Metrics (KPI’s) and know the relationships of the data, organized by logical categories(dimensions) that make up the result or answer to the question. This is what constitutes the Information Value Chain
Navigation
Let’s assume that you have a business problem, a business question that needs answers and you need to know the details of the data related to the business question.
Information Value Chain
Information Value Chain
Information Value Chain
• Business is based on Concepts.
• People thinks in terms of Concepts.
• Concepts come from Knowledge.
• Knowledge comes from Information.
• Information comes from Formulas.
• Formulas determine Information relationships based on quantities.
• Quantities come from Data.
• Data physically exist.
In today’s fast-paced high-tech business world this basic navigation (drill thru) business concept is fundamental and seems to be overlooked, in the zeal to embrace modern technology
In our quest to embrace fresh technological capabilities, a business must realize you can only truly discover new insights when you can validate them against your business model or your businesses Information Value Chain, that is currently creating your information or results.
Today data needs to be deciphered into information in order to apply formulas to determine relationships and validate concepts, in real time.
We are inundated with technical innovations and concepts it’s important to note that business is driving these changes not necessarily technology
Business is constantly striving for a better insights, better information and increased automation as well as the lower cost while doing these things several of these were examined and John Thuma’s‘ latest article
Historically though these changes were few and far between however innovation in hardware storage(technology) as well as software and compute innovations have led to a rapid unveiling of newer concepts as well as new technologies
Demystifying the path forward.
In this article we’re going to review the basic principles of information governance required for a business measure their performance. As well as explore some of the connections to some of these new technological concepts for lowering cost
To a large degree I think we’re going to find that why we do things has not changed significantly it’s just how, we now have different ways to do them.
It’s important while embracing new technology to keep in mind that some of the basic concepts, ideas, goals on how to properly structure and run a business have not changed even though many more insights and much more information and data is now available.
My point is in the implementing these technological advances could be worthless to the business and maybe even destructive, unless they are associated with a actual set of Business Information Goals(Measurements KPI’s) and they are linked directly with understandable Business deliverables.
And moreover prior to even considering or engaging a data scienkce or attempt data mining you should organize your datasets capturing the relationships and apply a “scoring” or “ranking” process and be able to relate them to your business information model or Information Value Chain, with the concept of quality applied real time.
The foundation for a business to navigate their Information Value Chain is an underlying Information Architecture. An Information Architecture typically, involves a model or concept of information that is used and applied to activities which require explicit details of complex information systems.
Subsequently a data management and databases are required, they form the foundation of your Information Value Chain, to bring this back to the Business Goal. Let’s take a quick look at the difference between relational database technology and graph technology as a part of emerging big data capabilities.
However, considering the timeframe for database technology evolution, has is introduced a cultural aspect of implementing new technology changes, basically resistance to change. Business that are running there current operations with technology and people form the 80s and 90s have a different perception of a solution then folks from the 2000s.
Therefore, in this case regarding a technical solution “perception is not reality”, awarement is. Business need to find ways to bridge the knowledge gap and increase awarement that simply embracing new technology will not fundamentally change the why a business is operates , however it will affect how.
Relational databases were introduced in 1970, and graph database technology was introduced in the mid to 2000
There are many topics included in the current Big Data concept to analyze, however the foundation is the Information Architecture, and the databases utilized to implement it.
There were some other advancements in database technology in between also however let’s focus on these two
History
1970
In a 1970s relational database, Based on mathematical Set theory, you could pre-define the relationship of tabular (tables) , implement them in a hardened structure, then query them by manually joining the tables thru physically naming attributes and gain much better insight than previous database technology however if you needed a new relationship it would require manual effort and then migration of old to new , In addition your answer it was only good as the hard coding query created
Early Relationship Conepts
2020
In mid-2000’s the graph database was introduced , based on graph theory, that defines the relationships as tuples containing nodes and edges. Graphs represent things and relationships events describes connections between things, which makes it an ideal fit for a navigating relationship. Unlike conventional table-oriented databases, graph databases (for example Neo4J, Neptune) represent entities and relationships between them. New relationships can be discovered and added easily and without migration, basically much less manual effort.
Nodes and Edges
Graphs are made up of ‘nodes’ and ‘edges’. A node represents a ‘thing’ and an edge represents a connection between two ‘things’. The ‘thing’ in question might be a tangible object, such as an instance of an article, or a concept such as a subject area. A node can have properties (e.g. title, publication date). An edge can have a type, for example to indicate what kind of relationship the edge represents.
Current Relationship Concepts
Takeaway.
The takeaway there are many spokes on the cultural wheel, in a business today, encompassing business acumen, technology acumen and information relationships and raw data knowledge and while they are all equally critical to success, the absolute critical step is that the logical business model defined as the Information Value Chain is maintained and enhanced.
It is a given that all business desire to lower cost and gain insight into information, it is imperative that a business maintain and improve their ability to provide accurate information that can be audited and traceable and navigate the Information Value Chain,Data Science can only be achieved after a business fully understand their existing Information Architecture and strive to maintain it.
Note as I stated above an Information Architecture is not your Enterprise Architecture. Information architecture is the structural design of shared information environments; the art and science of organizing and labelling websites, intranets, online communities and software to support usability and findability; and an emerging community of practice focused on bringing principles of design, architecture and information science to the digital landscape. Typically, it involves a model or concept of information that is used and applied to activities which require explicit details of complex information systems.
Ancient Relationship Concepts
In essence, a business needs a Rosetta stone in order translate past, current and future results.
In future articles we’re going to explore and dive into how these new technologies can be utilized and more importantly how they relate to Business outcomes
The primary take away from this article will be that you don’t start your Machine Learning project, MDM , Data Quality or Analytical project with “data” analysis, you start with the end in mind, the business objective in mind. We don’t need to analyze data to know what it is, it’s like oil or water or sand or flour.
Unless we have a business purpose to use these things, we don’t need to analyze them to know what they are. Then because they are only ingredients to whatever we’re trying to make. And what makes them important is to what degree they are part of the recipe , how they are associated
Business Objective: Make Desert
Business Questions: The consensus is Chocolate Cake , how do we make it?
Business Metrics: Baked Chocolate Cake
Metric Decomposition: What are the ingredients and portions?
2/3 cup butter, softened
1-2/3 cups sugar
3 large eggs
2 cups all-purpose flour
2/3 cup baking cocoa
1-1/4 teaspoons baking soda
1 teaspoon salt
1-1/3 cups milk
Confectioners’ sugar or favorite frosting
So here is the point you don’t start to figure out what you’re going to have for dessert by analyzing the quality of the ingredients. It’s not important until you put them in the context of what you’re making and how they relate in essence, or how the ingredients are linked or they are chained together.
In relation to my example of desert and a chocolate cake, an example could be, that you only have one cup of sugar, the eggs could’ve set out on the counter all day, the flour could be coconut flour , etc. etc. you make your judgment on whether not to make the cake on the basis of analyzing all the ingredients in the context of what you want to, which is a chocolate cake made with possibly warm eggs, cocunut flour and only one cup of sugar.
Again belaboring this you don’t start you project by looking at a single entity column or piece of data, until you know what you’re going to use it for in the context of meeting your business objectives.
Applying this to the area of machine learning, data quality and/or MDM lets take an example as follows:
Business Objective: Determine Operating Income
Business Questions: How much do we make, what does it cost us.
Business. Metrics: Operating income = gross income – operating expenses – depreciation – amortization.
Metric Decomposition: What do I need to determine a Operating income?
Gross Income = Sales Amount from Sales Table, Product, Address
Operating Expense = Cost from Expense Table, Department, Vendor
Etc…
Dimensions to Analyze for quality.
Product
Address
Department
Vendor
You may think these are the ingredients for our chocolate cake in regards to business and operating income however we’re missing one key component, the portions or relationship, in business, this would mean the association,hierarchy or drill path that the business will follow when asking a question such as why is our operating income low?
For instance the CEO might first ask what area of the country are we making the least amount of money?
After that the CEO may ask well in that part of the country, what product is making the least amount of money and who manages it, what about the parts suppliers?
Product => Address => Department => Vendor
Product => Department => Vendor => Address
Many times these hierarchies, drill downs, associations or relationships are based on various legal transaction of related data elements the company requires either between their customers and or vendors.
The point here is we need to know the relationships , dependencies and associations that are required for each business legal transaction we’re going to have to build in order to link these elements directly to the metrics that are required for determining operating income, and subsequently answering questions about it.
No matter the project, whether we are preparing for developing a machine learning model, building an MDM application or providing an analytical application if we cannot provide these elements and their associations to a metric , we will not have answered the key business questions and will most likely fail.
The need to resolve the relationships is what drives the need for data quality which is really a way of understanding what you need to do to standardize your data. Because the only way to create the relationships is with standards and mappings between entities.
The key is mastering and linking relationships or associations required for answering business questions, it is certainly not just mastering “data” with out context.
We need MASTER DATA RELATIONSHIP MANAGEMENT
not
MASTER DATA MANAGEMENT.
So final thoughts are the key to making the chocolate cake is understanding the relationships and the relative importance of the data/ingredients to each other not the individual quality of each ingredient.
This also affects the workflow, Many inexperienced MDM Data architects do not realize that these associations form the basis for the fact tables in the analytical area. These associations will be the primary path(work flow) the data stewards will follow in performing maintenance , the stewards will be guided based on these associations to maintain the surrounding dimensions/master entities. Unfortunately instead some architects will focus on the technology and not the business. Virtually all MDM tools are model driven APIs and rely on these relationships(hierarchies) to generate work flow and maintenance screen generation. Many inexperienced architects focus on MVP(Minimal Viable Product), or technical short term deliverable and are quickly called to task due to the fact the incurred cost for the business is not lowered as well as the final product(Chocolate Cake) is delayed and will now cost more.
Unless the specifics of questionable quality in a specific entity or table or understood in the context of the greater business question and association it cannot be excluded are included.
An excellent resource for understanding this context can we found by following: John Owens
Final , final thoughts, there is an emphasis on creating the MVP(Minimal Viable Product) in projects today, my take is in the real world you need to deliver the chocolate cake, simply delivering the cake with no frosting will not do,in reality the client wants to “have their cake and eat it too”.
Note:
Operating Income is a synonym for earnings before interest and taxes (EBIT) and is also referred to as “operating profit” or “recurring profit.” Operating income is calculated as: Operating income = gross income – operating expenses – depreciation – amortization.