

1. The Hook: The Death of the Experimental Era
For years, enterprise AI has lived in a protected sandbox. It was the era of the “pilot,” a time defined by low-stakes experimentation and “innovation at any cost.” But as we enter 2026, that era is officially dead. The transition to autonomous, agent-driven systems has hit a hard ceiling: the realization that innovation without control is a structural liability.
The “data chaos” that once served as mere operational friction has mutated into a fundamental threat to the business. Organizations are discovering that the velocity of their AI is capped by the integrity of their data foundations. We have shifted from a post-GDPR world of reactive compliance to a high-stakes environment where Accountability is the only currency that matters.
This transformation is driven by a convergence of maturing technologies and a heavy-handed regulatory reality. Enterprises are no longer asking if they canbuild it; they are asking if they can prove its origin, quality, and safety. In 2026, the competitive edge belongs to those who stopped chasing “more data” and started building a governed foundation for the age of autonomy.
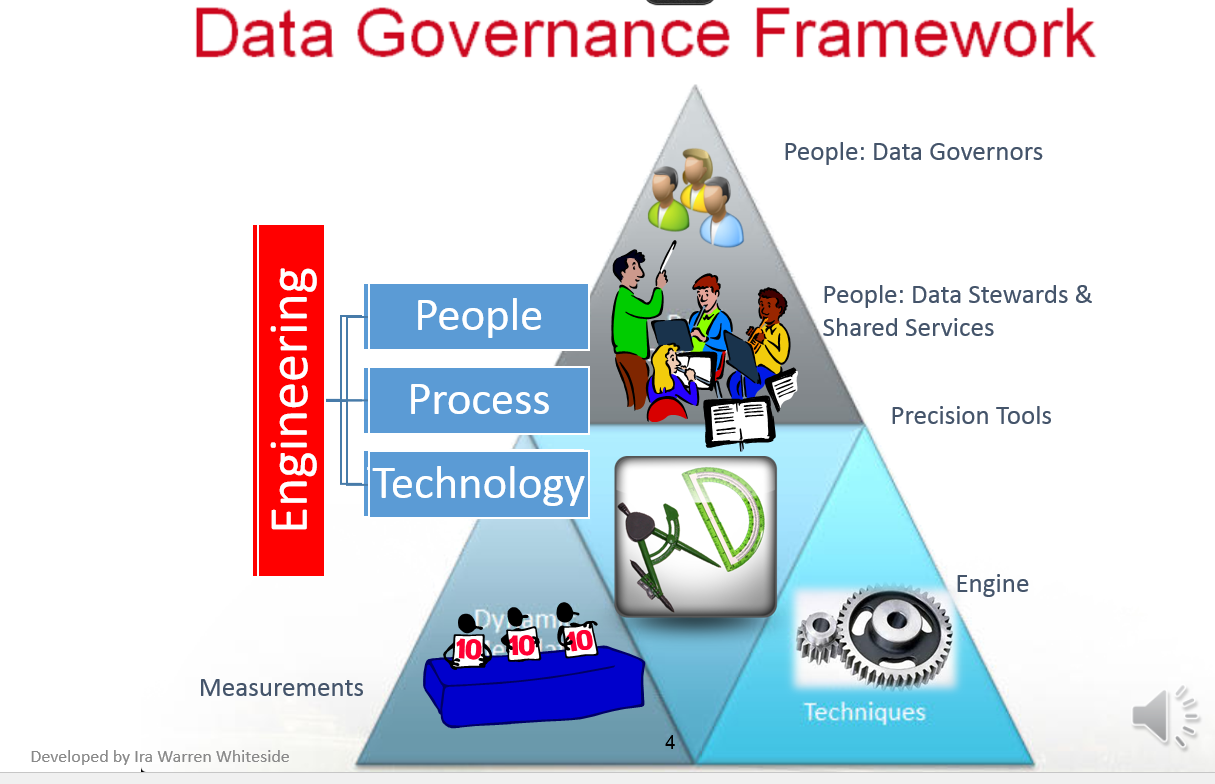
2. Governance is No Longer a Burden—It’s the Engine
August 2026 marks the first major enforcement cycle of the EU AI Act, and the shockwaves are being felt globally. Under Article 10, high-risk AI systems must meet rigorous quality criteria for training, validation, and testing datasets. Governance has evolved from a “reactive defense” tax into a “proactive competitive edge.”
A crucial strategic shift within Article 10 is the newly “legalized” use of sensitive data for the sake of fairness. Paragraph 5 allows providers to process special categories of personal data strictly for bias detection and correction, provided they meet stringent safeguards. This marks a pivot toward using governance as a tool for engineering social and technical trust.
To manage this, enterprises are establishing AI Governance Officers and adopting frameworks like ISO/IEC 42001 and the NIST AI RMF. These roles oversee model inventories and risk assessments, ensuring that intelligence is not just powerful, but sustainable and audit-ready.
“True intelligence must be portable, open, and sovereign—because your ability to move, scale, and adapt is what determines your competitive edge.” — Brett Sheppard
3. The Unstructured Data Goldmine: From Messy Files to Vector Reality
While 90% of enterprise data is unstructured—think images, video, and billions of PDFs—less than 1% was utilized for GenAI just two years ago. In 2026, the goldmine is finally open. The key has been the rise of Unstructured Data Integration (UDI) and Unstructured Data Governance (UDG).
This isn’t just about file storage; it’s about making legacy documents “agent-ready.” UDI pipelines now automate text chunking, embedding generation, and vectorization, allowing messy inputs to be ingested directly into vector databases. This enables Retrieval-Augmented Generation (RAG) at a scale that was previously impossible.
By unlocking these assets, companies are powering a new wave of Agentic AI capable of real-time risk detection and sophisticated document analysis. The goal is no longer just “search”—it is the conversion of raw organizational knowledge into actionable intelligence.
4. The Great Rapprochement: The Hybrid “Meshy Fabric”
The architectural civil war between Data Fabric and Data Mesh has ended in a hybrid marriage. Organizations that fell into the “velocity trap”—focusing on decentralization (Mesh) without automated infrastructure (Fabric)—found themselves buried in inconsistency. The most successful 2026 enterprises use a Data Fabric to automate intelligence while using a Data Mesh to enforce domain-led ownership.
Architectural Pivot
Data Fabric (Automation Layer)
Data Mesh (People/Process)
Strategic Driver
Unifying distributed systems via active metadata.
Managing data as a product with domain accountability.
Implementation
Technology-centric; automated integration.
Organizational-centric; domain-owned governance.
Key Enabler
Augmented data catalogs and AI-driven mapping.
Self-serve platforms and federated standards.
This “meshy fabric” ensures that the Data Fabricprovides the intelligent connective tissue, while the Data Mesh ensures the human domain experts are accountable for the quality of the data products being fed into AI agents.
5. Synthetic Data: The “Privacy-First” Training Hack
The “Privacy Paradox”—the friction between the need for massive datasets and the legal mandates of the GDPR—has been bypassed via Privacy Enhancing Technology (PET). Synthetic data, which mirrors the statistical patterns of real-world datasets without copying individual identities, has moved into the mainstream.
Beyond privacy, synthetic data is now a primary tool for bias mitigation. It allows developers to fill “data gaps” and create “edge cases” that real-world datasets often ignore. In sectors like healthcare and finance, this mimics the statistical properties required for high-utility models without the risk of re-identification or regulatory exposure.
“Synthetic data can be defined as data that has been generated from real data and that has the same statistical properties as the real data.” — Dr. Khaled El Emam
6. “Agent-Ready” Data and the Science of Model Provenance
As AI evolves toward Agentic AI—systems that act autonomously in procurement or IT operations—the demand for Accountability has reached a fever pitch. For an agent to execute a contract, it must have “agent-ready” data: information that is traceable, high-quality, and context-rich.
Simultaneously, the industry is moving from heuristic fingerprinting to mathematical proof. Using the Model Provenance Set (MPS), a sequential test-and-exclusion procedure, organizations can now achieve a provable asymptotic guarantee of a model’s lineage.
This isn’t just a tool; it’s a statistical proof. It allows enterprises to detect unauthorized reuse and protect intellectual property by identifying related models in complex derivation chains. In 2026, you don’t just “verify” a model; you prove its provenance.
7. Sovereignty is the New Architecture
Cloud strategy has shifted from a matter of IT efficiency to a compliance and risk management obligation. Driven by the EU Data Act, organizations are pivoting toward Sovereign Multicloud Architectures. This isn’t just about local hosting; it’s about the legal mandate of “fair cloud switching” and “vendor neutrality.”
The EU Data Act has fundamentally changed data sharing by mandating new rights for data access and portability. This has forced a mass redesign of data-sharing processes and vendor contracts. In 2026, the question of “where your data sits” is a matter of sovereignty.
Public sector and finance leaders are leading this charge, moving critical workloads to certified sovereign environments. They recognize that in the age of autonomous AI, control over the underlying infrastructure is the only way to mitigate the risk of vendor lock-in and geopolitical friction.
8. Conclusion: The Trust Dividend
The digital economy of the next decade is being built on the foundations we lay today. By 2026, the convergence of Governance, Sovereignty, and Automation has created a “Trust Dividend.” Those who invested in making their data agent-ready and audit-proof are now scaling autonomous systems with a level of confidence their competitors can’t match.
As we look toward an increasingly autonomous future, the question for every technical leader has shifted:
Is your data estate merely a collection of assets, or is it a governed foundation ready for the age of autonomy?


