http://www.ailerontechnology.com/
more to come ….
AileronTechnology.com
Phone: 716-997-2399
Email: Info@AileronTechnology.com
John Indelicato – Founder

http://www.ailerontechnology.com/
more to come ….
AileronTechnology.com
Phone: 716-997-2399
Email: Info@AileronTechnology.com
John Indelicato – Founder
Our daughter Victoria Stasiewicz graduated today and with your husband Brandon Stasiewicz. Theresa and I are very proud of Victoria and her incredible accomplishments.


The primary take away from this article will be that you don’t start your Machine Learning project, MDM , Data Quality or Analytical project with “data” analysis, you start with the end in mind, the business objective in mind. We don’t need to analyze data to know what it is, it’s like oil or water or sand or flour.
Unless we have a business purpose to use these things, we don’t need to analyze them to know what they are. Then because they are only ingredients to whatever we’re trying to make. And what makes them important is to what degree they are part of the recipe , how they are associated

Business Objective: Make Desert
Business Questions: The consensus is Chocolate Cake , how do we make it?
Business Metrics: Baked Chocolate Cake
Metric Decomposition: What are the ingredients and portions?
2/3 cup butter, softened
1-2/3 cups sugar
3 large eggs
2 cups all-purpose flour
2/3 cup baking cocoa
1-1/4 teaspoons baking soda
1 teaspoon salt
1-1/3 cups milk
Confectioners’ sugar or favorite frosting
So here is the point you don’t start to figure out what you’re going to have for dessert by analyzing the quality of the ingredients. It’s not important until you put them in the context of what you’re making and how they relate in essence, or how the ingredients are linked or they are chained together.
In relation to my example of desert and a chocolate cake, an example could be, that you only have one cup of sugar, the eggs could’ve set out on the counter all day, the flour could be coconut flour , etc. etc. you make your judgment on whether not to make the cake on the basis of analyzing all the ingredients in the context of what you want to, which is a chocolate cake made with possibly warm eggs, cocunut flour and only one cup of sugar.
Again belaboring this you don’t start you project by looking at a single entity column or piece of data, until you know what you’re going to use it for in the context of meeting your business objectives.
Applying this to the area of machine learning, data quality and/or MDM lets take an example as follows:
Business Objective: Determine Operating Income
Business Questions: How much do we make, what does it cost us.
Business. Metrics: Operating income = gross income – operating expenses – depreciation – amortization.
Metric Decomposition: What do I need to determine a Operating income?
Gross Income = Sales Amount from Sales Table, Product, Address
Operating Expense = Cost from Expense Table, Department, Vendor
Etc…
Dimensions to Analyze for quality.
Product
Address
Department
Vendor
You may think these are the ingredients for our chocolate cake in regards to business and operating income however we’re missing one key component, the portions or relationship, in business, this would mean the association,hierarchy or drill path that the business will follow when asking a question such as why is our operating income low?
For instance the CEO might first ask what area of the country are we making the least amount of money?
After that the CEO may ask well in that part of the country, what product is making the least amount of money and who manages it, what about the parts suppliers?
Product => Address => Department => Vendor
Product => Department => Vendor => Address
Many times these hierarchies, drill downs, associations or relationships are based on various legal transaction of related data elements the company requires either between their customers and or vendors.
The point here is we need to know the relationships , dependencies and associations that are required for each business legal transaction we’re going to have to build in order to link these elements directly to the metrics that are required for determining operating income, and subsequently answering questions about it.
No matter the project, whether we are preparing for developing a machine learning model, building an MDM application or providing an analytical application if we cannot provide these elements and their associations to a metric , we will not have answered the key business questions and will most likely fail.
The need to resolve the relationships is what drives the need for data quality which is really a way of understanding what you need to do to standardize your data. Because the only way to create the relationships is with standards and mappings between entities.
The key is mastering and linking relationships or associations required for answering business questions, it is certainly not just mastering “data” with out context.
We need MASTER DATA RELATIONSHIP MANAGEMENT
not
MASTER DATA MANAGEMENT.
So final thoughts are the key to making the chocolate cake is understanding the relationships and the relative importance of the data/ingredients to each other not the individual quality of each ingredient.
This also affects the workflow, Many inexperienced MDM Data architects do not realize that these associations form the basis for the fact tables in the analytical area. These associations will be the primary path(work flow) the data stewards will follow in performing maintenance , the stewards will be guided based on these associations to maintain the surrounding dimensions/master entities. Unfortunately instead some architects will focus on the technology and not the business. Virtually all MDM tools are model driven APIs and rely on these relationships(hierarchies) to generate work flow and maintenance screen generation. Many inexperienced architects focus on MVP(Minimal Viable Product), or technical short term deliverable and are quickly called to task due to the fact the incurred cost for the business is not lowered as well as the final product(Chocolate Cake) is delayed and will now cost more.
Unless the specifics of questionable quality in a specific entity or table or understood in the context of the greater business question and association it cannot be excluded are included.
An excellent resource for understanding this context can we found by following: John Owens
Final , final thoughts, there is an emphasis on creating the MVP(Minimal Viable Product) in projects today, my take is in the real world you need to deliver the chocolate cake, simply delivering the cake with no frosting will not do,in reality the client wants to “have their cake and eat it too”.

Note:
Operating Income is a synonym for earnings before interest and taxes (EBIT) and is also referred to as “operating profit” or “recurring profit.” Operating income is calculated as: Operating income = gross income – operating expenses – depreciation – amortization.

You get what you inspect, not what you expect!
This post will combine business needs with current capabilities for scoring data sets/tables large or small consistently. The methodology and approach we’re going to discuss was implemented with AWS Athena and QuickSight.
A few years ago we put together an article on simple data profiling in a simple sql environment.
We’ve had the occasion to use this method at every client we,ve been to in the last decade.
A very important concept in big data, data mining IT integration and analytics projects is the idea of analyzing, surveying profiling your data and knowing what you’re going to have deal with before, you have to deal with it in a one off fashion
Why Score data , first a discussion of the business value of why this matters.
Let’s assume that you have a business problem, a business question that needs answers and you need to know the details.
There is a predisposition today to call a data scientist.
The problem is you don’t need to know the science behind the data, you need to know, the information that can be derived from the data
Business is based on Concepts.
People thinks in terms of Concepts.
Concepts come from Knowledge.
Knowledge comes from Information.
Information comes from Formulas.
Formulas determine Information relationships based on Quantities.
Quantities come from Data.
Data physically exist.
Data needs to be deciphered into information in order to apply formulas to determine relationships and validate concepts.
My point is proving these low level concepts is probably worthless to the business and maybe even destructive, unless they are associated with a actual set of Business Goals or Measurements and they are linked directly with understandable Business deliverables.
And moreover prior to even considering or engaging a data scientist or attempt data mining you should process your datasets through a ‘Scoring” process.
When we say linking we mean creating an “information value chain” relating Business Goals to Business Questions and breaking them down(decomposing) them into the following:

There are two things necessary to Score a data set or file universally.
File Scoring: Overall combined score of all columns based on standards data profiling measures(count of nulls, minimum value, maximum value, mode value, total records, unique count, etc…)
Column Scoring: measures for each column or domain including but not limited to frequency of distinct values, patterns.
These two measure will combine to provide a “Score” and the necessary detail to analyze the results in detail and predict corrective methods and fitment for possible feature engineering for machine learning models as well as general data quality understanding.
Back to how we got here:
Our projects were standard data warehouse, integration, MDM old school projects.
Nonetheless they required a physical or virtual server, a database and usually they were limitations on the amount of data that could be profiled due to these constraints.
However the problems we faced then and that our clients faced are the same problems they face today only exponentially bigger.
Fast forward 10 years. No Database, No Server, No Limitations sizewize, and pay for only what you use.
This has only been possible since last year it was not due virtual machines, or big data.
It is due to the advent of serverless sql, as well as other serverless technologies
We created a few diagrams below to try to illustrate the concepts both from a logical and physical perspective
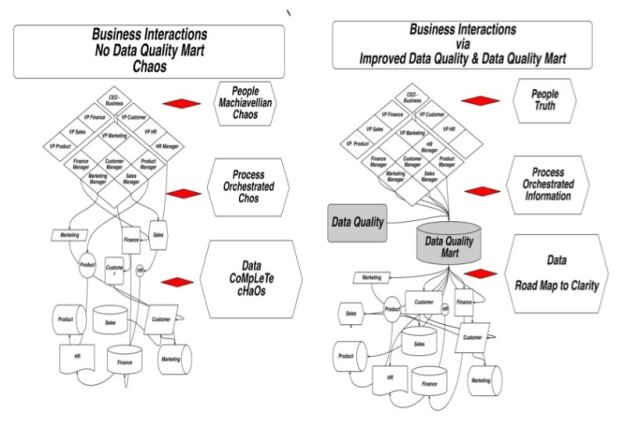
As you can see below most projects begin with the idea of ingesting data transforming it or summarizing it in some manner and creating reports as fast as possible.
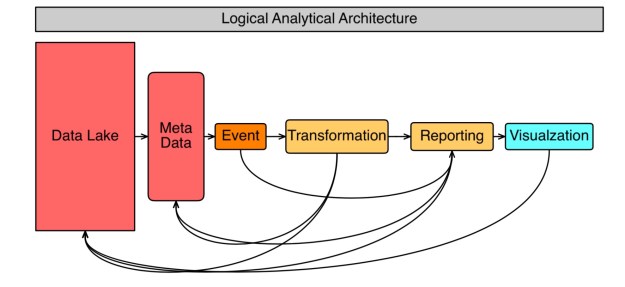
What I find most often is that the source analysis, the matching of source data content contextualization to business requirements and expected outcome is usually last, or discovered during the build. This requires the inclusion and creation of a meta-data mart and the ability to provide scoring and analysis on the contextual of data agnostic way, put simply scoring the data or content , Purely on the data, prior to trying to use it for business intelligence, reporting, visualizations and or most importantly data mining.
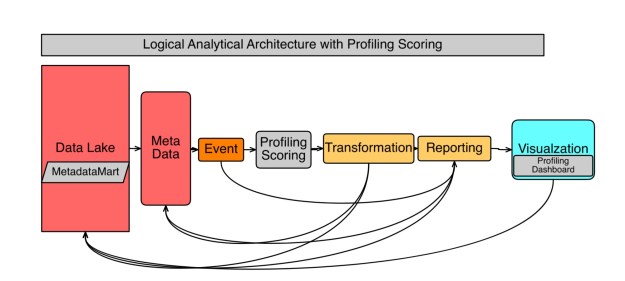
As you can see below we need to insert simple processes Conceptionally the same as outlined in my original blog in order to gain information and insight and predictability in providingi business intelligence output , visualization or featuring engineering for possible data mining.
So let’s explore what we can accomplish now without a server without a database.
We have implemented my own version of the capabilities for profiling using Athena the new AWS offering as well as a few other tools.

AWS and in particular Athena will provide the capability to accomplish all these things on demand and pay as we go
We plan to follow this article up with detailed instructions on how to accomplish this however as you can see it is using all the existing standard tools for the S3, Athena and Glue,Lambda.

Well actually I spent some time in the QuickSight tool and below example is a pathetic example of a dashboard it’s just to show you real quick the idea of looking at aggregate patterns of data and details of data visually and literally after only a few minutes of effort.
Here a quick example looking at Phone1 column patterns for my customer dataset. Notice the majority of records is in the 999-999-9999 pattern for 89%.

Then we add a Field and do a quick drill into the pattern representing 14% or 9999999999.

Now we can see the actual numbers the make up the 14%

Another fast change and we are in a Bar chart.

I know these are very simple visuals however the last point I’d like to make is that this experiment took us about 4 hours and we did on an ipad Pro, including signing up and creating an AWS account.
Last word on connecting the business objectives to the data after scoring it. This may seem like a cumbersome process, however unless you link the informational and abstract concepts directly to data columns or fields you will never have a true understanding of information based on your data. This mapping is the key, the Rosetta stone for deciphering you data,

(Father & Daughter) Data Governance
As proud parents Theresa Whiteside and I would like to spread the word to our daughter Victoria Stasiewicz will be speaking at the MDM Summit in San Francisco and add to that our congratulations on her recent promotion as “Manager of Data Governance” for HealthNOW.
Jim Stagnitto thanks for your part in this journey


DNA and the concept of MDM( Master Data Management) or Modern ML/AI Data Preparation have many similarities.
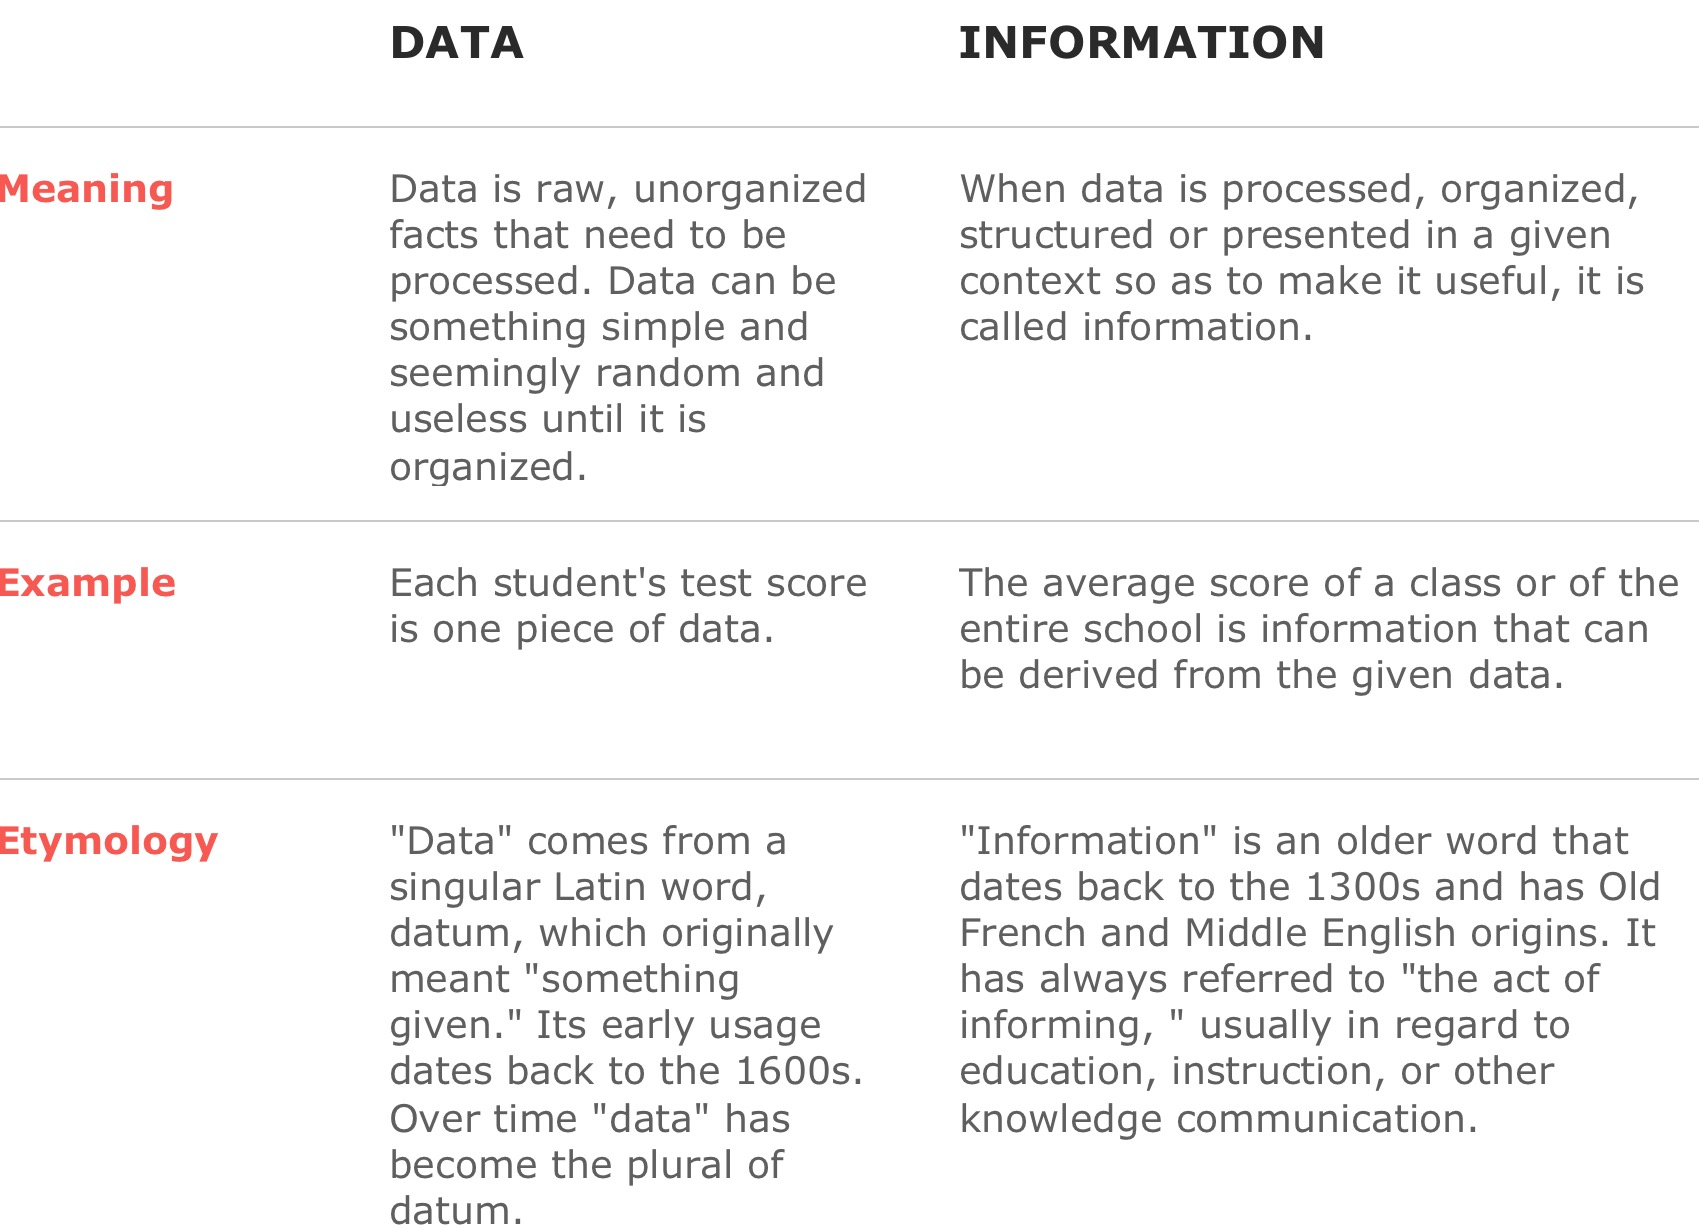
“There is a subtle difference between data and information.”
We in IT have complicated and diluted the concept and process of analyzing data and business metrics incredibly in the last few decades. We seem to be focus in on the word data.
And if you consider the primary business objectives of MDM is provide consistent answers with standard business definitions and an understanding of the relationship or mappings of business outcomes to data elements.
DNA vs MDM or IT’s version of DNA.
The graphic I’ve chosen for this post symbolizes the linkage or lineage of human beings to DNA. What I’d like to do is relate the importance of lineage of data to examples of human how DNA communicate lineage and then discuss it in our IT as it relates to business functionality
Living Organisms are very complex as is a company and its data or information.
The genetic information of every living organism is stored inside these nucleic the basic data.
There are two types of nucleic acids(NA) namely:
DNA– Defines Traits, Characteristics
RNA – Communication, transfers information and synthesis.
Lets examine them.
DNA- Defines Traits, Characteristics

DNA-Deoxyribonucleic acid – In most living organisms (except for viruses), genetic information is stored in the form of DNA.
RNA – Communication, transfers information and synthesis
.

RNA – can move around in the cells of living organisms and serves as a genetic messenger, passing the information stored in the cell’s DNA from the nucleus to other parts of the cell for protein synthesis.
So here goes this is a bit of a stretch but if you consider DNA is the “Data” and a person the “Information” is created from the communication through the RNA.
To continue the analogy the DNA or chromosomes in and by themselves are out of context. It’s only once they been passed from one person to the next driven by RNA and result in a human being in that they become contextually realized as a human.
Again if we break down human DNA and inspected it, we can tell many things origin, or ancestory , traits of the person possible, diseases of the person, but it needs to be processed for us to understand the actual person.
So my point in relation to various approaches to traditional MDM or Master Data Management yis that this(DNA) is how life is created, it’s science, it’s not a methodology or product in approach a vendor guess work it’s real and the main point is “lineage” is the key
“There is a subtle difference between data and information. Data are the facts or details from which is derived. Individual pieces of data are rarely useful alone. For data to become information, data needs to be put into context.”
Examples of Data and Information as it relates to MDM
The history of temperature readings all over the world for the past 100 years is data.
If this data is organized and analyzed to find that global temperature is rising, then that is information.
“Mislesading” Data”
Data needs to be interpreted and analyzed, it is quite possible — indeed, very probable — that it will be interpreted incorrectly.
When this leads to erroneous conclusions, it is said that the data are misleading. Often this is the result of incomplete data or a lack of context.
For example, your investment in a mutual fund may be up by 5% and you may conclude that the fund managers are doing a great job. However, this could be misleading if the major stock market indices are up by 12%. In this case, the fund has underperformed the market significantly.
Comparison charts
“Synthesis: the combining of the constituent elements of separate material or abstract entities into a single or unified entity ( opposed to analysis, ) the separating of any material or abstract entity into its constituent elements.”
Synthesis in MDM
Communication, transfers information and synthesis, like RNA several companies are prevelant in terms of data movement and replication, in essence data logistics
Defines Traits, Characteristics like DNA many companies have developed and refined products and the techniques required for during these. They are data profiling , domain pattern profiling and record linkage, the basis of transforming data into information .
However lineage is the key, and without this to serve as a connection between data and information, in essence there is no information. And in this case the “information” is the business term from the business glossary.
The integration of data movement capability and the linking of data profiling capabilities can result in providing a business the capabilities answering business question with certitude through the transparency of lineage.
To translate this into “business terms” it’s very similar to providing an audit trail in that a business can ask this questions like what customers are the most profitable look at those customers and then drill into wood products what areas with those profits coming
What lineage accomplishes is to lay a trail of cookie crumbs for data movement but for your business questions, it’s simply makes sure that you can connect the dots as data gets moved and/or translated and/or standardize and or cleansed throughout your enterprise.
And with the simple action of linking data file metadata of files, columns , profiling results to a businesses glossary or business terms, will result in deeply insightful and informative business insight and analysis.
“Analysis the separating of any material or abstract entity into its constituent elements”
In order for a business manager for analyze you need to be able to start the analysis at a understandable business terminology level. And then provide the manager with the ability to decompose or understand lineage from a logical perspective.
There are three essential capabilities required for analysis and utilizing lineage to answer business questions via a meta-data mart and these are very similar to the pattern that exist in DNA.
1. Data profiling and domain(column) analysis as well as fuzzy matching processes that are available in many forms:
a. – Scan all the values within each column and provide statistics(counts) such as minimum value, maximin value, mode(most occuring) value, number of missing value etc…
b. Frequency or Column value Patterns – determine the counts of distinct values within a column and also identify the distinct pattern occurring for all values within a single column and associated counts ie(SSN = 123-45-6789 , SSN PATTERN = ‘999-99-9999’
c. Fuzzy Matching( similarity algorithms) – This capability enables the find the counts of duplicate or similar text values.
2. The results need to be stored is a “Metadata-mart” in order to see the patterns, results and associations providing lineage and retatingraw data to business terms and hierarchies.
3. Visualization and analysis capability to allow for analysis, drill down into data mart aggregated and statistical contents and associated business hierarchies and businessterminology
Underlying each of these analytical capabilities is a set of refined processes, developed and proven code for accomplishing these basic fundamental task.
In future post I will describe how to implement these capabilities with or without vendor products, from a logical perspective.
References:
http://www.diffen.com/difference/Data_vs_Information
After some intense analysis, I’ve come to the conclusion that the datalake concept is only marginally beneficial to a business.
Specifically to a business who has the need to collect clickstream data or track web information and only if they are very high volume.
My primary concern is to always look at organizing and processing data based on solid data quality principles. And as such a data lake or HDFS or hadoop cluster can only serve as an initial landing area, as opposed to a staging area. After which appropriate data quality processes still need to be followed in a traditional format.
I believe a business may make a major mistake by simply pursuing the implementation of the data lake without fully realizing it’s place in an overall information architecture needed to provide a business accurate answers to business questions.
Furthermore considering how Hadoop aka. Data lake designed as a low cost method of collecting and storing vast amounts of data, expensive hardware should definitely be avoided.
As I said before you embark on a “big data” Hadoop or a data lake be sure you understand the implications and the required data quality and cleansing that will be required to make the information analytically acceptable and actionable.
You might also want to consider that Google abandoned Map Reduce and Hadoop.”years ago”
Google Replaces MapReduce With New Hyper-Scale Cloud Analytics System
This article will address the necessary steps for efficient data/record processing that includes a record linkage or fuzzy matching step. First we are going to define the matching process, well-researched solutions and inherent performance problem.

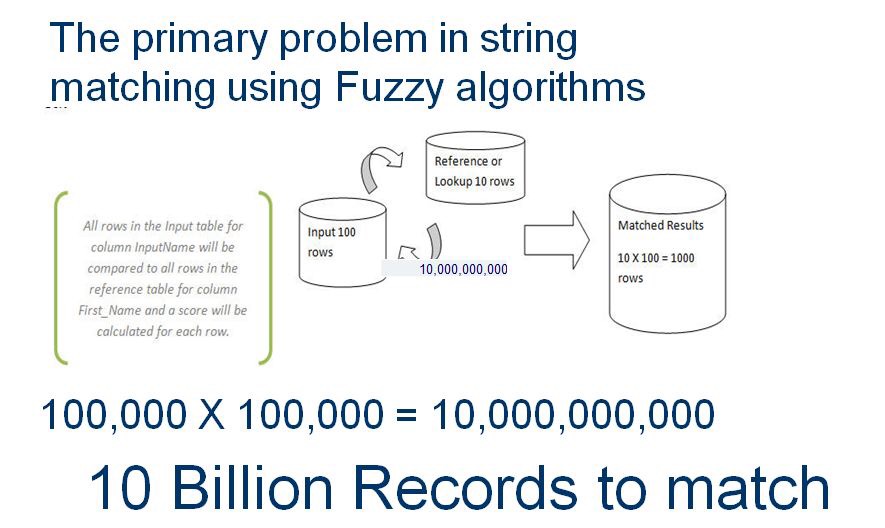
Any record linkage operation will ultimately require string matching and will require comparing some columns in a complete set of records to all the records in another set – effectively a cross join. This is a very resource intensive process. The trick here is to reduce the number of string comparisons as much as possible. This problem has been researched by many academics.
Over at Henrik Liliendahl Sorensen’s LinkedIn Group for Data Matching, Bill Winkler, principal researcher at the US Census Bureau has shared several reference papers on the reasoning and methodology for record linkage using blocking. They are excellent and I wanted to share them with you:
Chaudhuri, S., Gamjam, K., Ganti, V., and Motwani, R. (2003), “Robust and Efficient Match for On-Line Data Cleaning,” ACM SIGMOD ’03, 313-324.
Baxter, R., Christen, P. and Churches, T. (2003), “A Comparison of Fast Blocking Methods for Record Linkage,” Proceedings of the ACM Workshop on Data Cleaning, Record Linkage and Object Identification, Washington, DC, August 2003.
Winkler, W. E. (2004c), “Approximate String Comparator Search Strategies for Very Large Administrative Lists,” Proceedings of the Section on Survey Research Methods, American Statistical Association, CD-ROM.
Here are several papers I have used with some samples of open-source algorithms:
William W. Cohen; Pradeep Ravikumar; Stephen Fienberg; Kathryn Rivard. A technical paper on string-matching methods which uses SecondString (PDF).
Mikhail Bilenko and Raymond Mooney, University of Texas at Austin; William Cohen, Pradeep Ravikumar, and Stephen Fienberg, Carnegie Mellon University, “Adaptive Name Matching in Information Integration“.
William W. Cohen Pradeep Ravikumar Stephen E. Fienberg, “A Comparison of String Distance Metrics for Name-Matching Tasks“.
How our brains handle matching challenges
Consider this: you are watching a school concert and several dozen children are up on stage. Now, pick out the twins. You would probably start with looking for groups based on hair color, hair length, etc. long before you start comparing faces. This is, in essence, grouping or blocking. If you line the blonds on the left and the brunettes on the right, you now have two blocks.

The next step in identifying the twins is to repeat the process with new groups until you have found the twins. Compare all blonds, then brunettes, and so on. Then, move on to short hair, long hair, and so on. Finally, move on to similar face shapes. This is fuzzy matching.
Hair is blond or brunette, long or short; but faces are a collection of features, and have a pattern forming an image. Our brains instinctively look for faces that are similar, then compare more closely. The obvious point here is to only begin comparing faces once we have narrowed down to just a small group of children.
Let’s examine the steps involved as a logical process.

1. Cleansing and Standardization
The objective here is to cleanse and format the required columns. The key here is to get as much consistency and uniformity in each column as possible. For instance in columns like Zip Code or Address you want to have correct values and proper patterns. This is critical to reducing unnecessary processing time during the match process. One way to automate this step is to use data profiling with some pattern matching or REGEX (Regular Expression) cleansing.
2. Categorize or Group records
Once we have cleansed and standardized our input we can then examine how to best split, group or categorize our records into separate sets. An example of this would be to put records for each states (Arkansas, Maine etc.) into a group. In Record Linkage jargon, this is called a Blocking Index.
The thinking here is that we want to use as many columns for equality matches as possible, thereby reducing the records that need fuzzy matching. Obviously if we can match on state, zip, and phone it will leave only the name field as a candidate for a fuzzy match. Grouping sets of records by state or by the first three characters of the phone number means we need to process fewer records during the match. As we discussed earlier, a fuzzy match is in effect a cross join and can quickly result in a very high volume of record and column comparisons.
William Winkler, the Chief Researcher for Census Bureau, has detailed the recommended groups of column types that can be most effective. The best groups or Blocking Indexes vary depending on the columns available. Winkler particularly recommends the top 5:
ZIP, first three characters of surname.
First ten digits of phone number.
First three characters of last name, first three characters of first name.
ZIP, house number.
First three characters of ZIP, day-of-birth, month-of-birth.
First three characters of last name, first three characters of first name, month-of-birth.
First three characters of surname, first three characters of phone, house number.
First three characters of surname, first three characters of first name, date-of-birth.
First three characters of first name, first three characters of ZIP, house number.
First three characters of last name, first three characters of ZIP, first three characters of phone number.
First three characters of last name, first three characters of first name (2-way switch), first three characters of ZIP, first three characters of phone number.
3. Split
Split records, based on the criteria in the Blocking Indexes. Create separate data streams to support parallel match processing.
4. Compare
Compare by applying fuzzy matching algorithm to groups of records and determine scores based on the groups selected. We will discuss various algorithms in a future post. The huge problem with the fuzzy matching processing performance is that the matches are similar and not exact. If you get a commercial matching tool and start comparing data sets, I guarantee the tool will frantically try to get you to define as many columns or fields for a match (Blocking Index) as possible, before you do any fuzzy stuff.
5. Split
Split into separate result categories of match, no match and possible matches.
6. Analyze
Analyze results of no matches and possible matches. Matches need to be reviewed for accuracy. this can be done with tools or in some cases manually.
7. Evaluate
Evaluate results manually using matching tools to determine if the best algorithms have been combined. Possible matches need to be evaluated and analyzed. Determine if additional cleansing or different matching algorithms could be utilized more effectively.
SSIS Example of Fuzzy Matching with Blocking Indexes
In the example below I will demonstrate Steps 2-5 using the SSIS Fuzzy Grouping and Conditional Split Components as well as the SSIS Pipeline Architecture for parallel processing. In SSIS the basic process for implementing blocking indexes involves using a Conditional Split to create multiple threads of records and applying the Fuzzy Grouping Transform. For this example we assume a basic customer input with: First Name, Last Name, Address, State, Zip, and Phone.
We will split the records based on State in the following manner:
Block01 = AK, AL, AZ, CA, CO
Block02 = FL, GA, MI, MA, MN
Block02 = Everything else.
Putting the theory to the test
I created a package using AdventureWorks that processes and uses Fuzzy Grouping for 10,000 records without using a blocking index and the execution time was 39 minutes.
I then ran the same 10,000 records with a conditional split, creating a blocking index with three parallel threads by blocking on state. Using a blocking index, the execution time was 20 minutes.
In this case the execution time was cut by almost half. When processing larger volumes, the net reduction in time would be much greater.
The following is a detailed no need to refer them and less you’re interested in understanding an actual Microsoft example. Other examples are available contact me
Microsoft SSIS example
How to do it
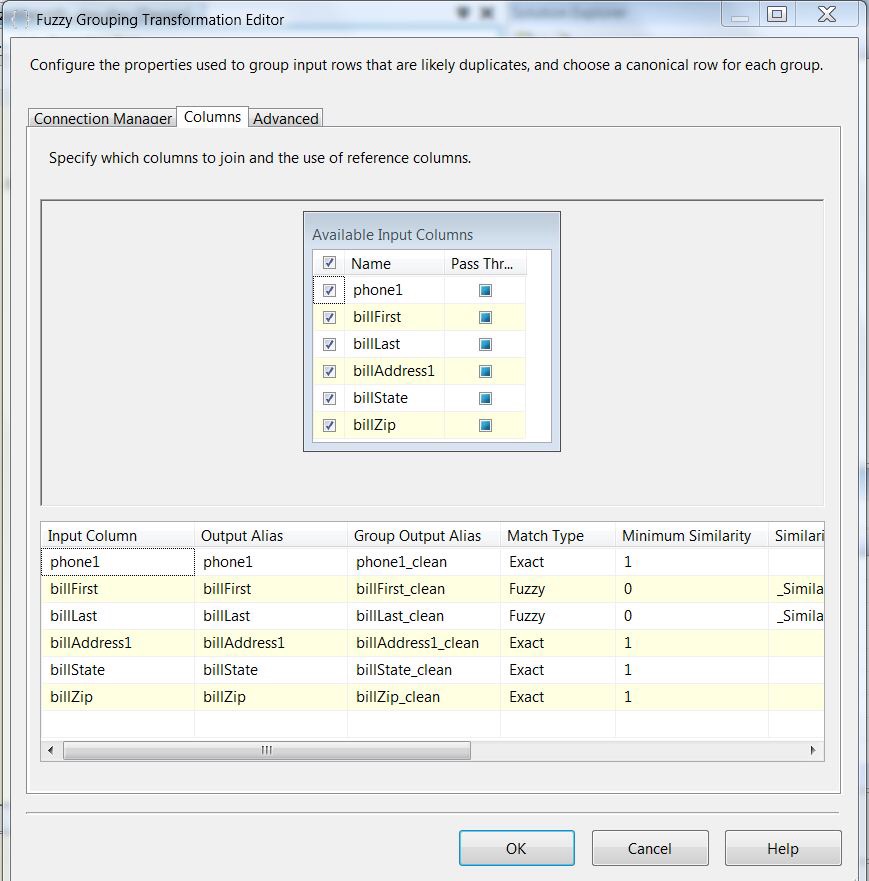
Here is the setup for the Fuzzy Grouping. This transform has a very straightforward configuration. Once you have selected the desired input columns you can then select the Match Type, Fuzzy or Exact. You will note that except for First and Last Names, all columns are set for an exact match. First and Last Name will be set to Fuzzy. This set up will be the same for both tests. For more detailed information on how to set up the Fuzzy Group Transform, take a look here.
Here is the first package without splitting records via a blocking index.

Run this test first. Note the time elapsed in the Execution Status tab.
Now let’s change the packages and implement what we have discussed. We will split the paths, leveraging the parallelism and the pipeline capabilities in SSIS. Revise the package by adding a Conditional Split and multiple Fuzzy Grouping Transforms.
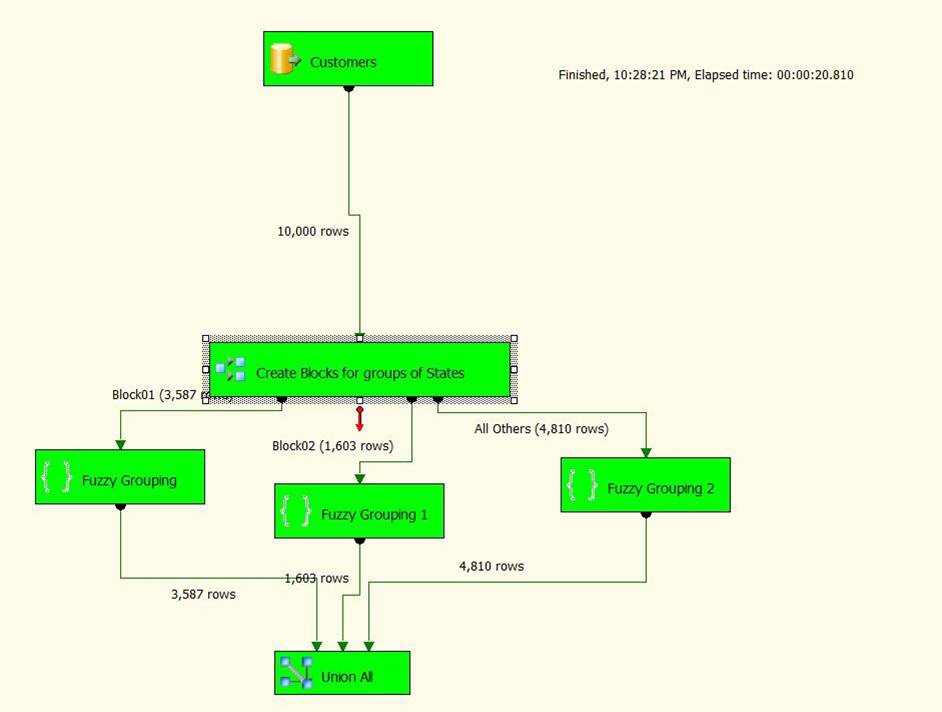
Here is the setup for the Condition Split used to implement the blocking index, where we split our records into three blocks of states. We may still need to check across states, but all their matches will be eliminated.
Once you have configured the Conditional Split you need to connect the separate outputs to the original Union All component. If you are not familiar with the Conditional Split check out Andy Leonard’s excellent post here.

One more important point on package performance: there are two properties that can help improve performance for SSIS DataFlows when properly configured. These are DefaultBufferMaxRows and DefaultBufferSize, which are covered well in SQLRUNNER’s blog.
Summary
The major takeaway from this article is that you should apply the same logical thinking to using the SSIS Fuzzy Grouping as you do in your own everyday thinking and matching problems.
Secondly, the capability that enables this technique to succeed is the pipeline architecture in SSIS.
On a final note, here is the definition of the pipeline architecture as defined by Microsoft. I have included this in my other SQL Server Central articles on Fuzzy Matching and I think it is important here to take a few minutes to review this critical capability at the heart of the SSIS architecture:
“At the core of SSIS is the data transformation pipeline. This pipeline has a buffer-oriented architecture that is extremely fast at manipulating row sets of data once they have been loaded into memory. The approach is to perform all data transformation steps of the ETL process in a single operation without staging data, although specific transformation or operational requirements, or indeed hardware may be a hindrance. Nevertheless, for maximum performance, the architecture avoids staging. Even copying the data in memory is avoided as far as possible. This is in contrast to traditional ETL tools, which often requires staging at almost every step of the warehousing and integration process. The ability to manipulate data without staging extends beyond traditional relational and flat file data and beyond traditional ETL transformation capabilities. With SSIS, all types of data (structured, unstructured, XML, etc.) are converted to a tabular (columns and rows) structure before being loaded into its buffers. Any data operation that can be applied to tabular data can be applied to the data at any step in the data-flow pipeline. This means that a single data-flow pipeline can integrate diverse sources of data and perform arbitrarily complex operations on these data without having to stage the data.
It should also be noted though, that if staging is required for business or operational reasons, SSIS has good support for these implementations as well.
This architecture allows SSIS to be used in a variety of data integration scenarios, ranging from traditional DW-oriented ETL to non-traditional information integration technologies.”
Ira Warren Whiteside Blog
“Do, or do not. There is no try.”
“Karo yaa na karo, koshish jaisa kuch nahi hai.”
The secret to implementation of data quality is to follow the path below, mainly very Business Driven and focused approach extremely iterative and collaborative
The software or tools may change but the logical path, defined by identifying important business measurements required for successful and measurable results will not.
The key is not think of it as some kind of technical POC or tool trial.
It is important to realize “What” you want to measure and there by understand will not change, only “How” you create the result will change.
While many organizations are led down the path of creating a Data Governance Program, it’s frankly to large of a task, and more importantly cannot adequately be planned, with first implementing a Data Quality program, with analytical capabilities.
For example in the real world if you wanted to drill an oil well, first and before you plan, budget, move or buy equipment you would, survey the land, examine the minerals and drill a test well. This is not the same as in our IT data world as doing a vendor or tool Proof of Concept(POC) or a pilot to see if the vendor product works.
The oil company know exactly how there equipment works and the processes they will follow, they are trying to determine “where” to drill , not “how” to drill .
In our world , the IT WORLD, we act as if we need to “somehow” complete a “proof of concept” without really know exactly what concept we’re proving.
Are we proving the tool works, are we proving our data has errors or our processes are flawed in essence we verifying that if we find bad data we want to fix them or the data, none of these concepts need “proving”.
My point is proving these low level concepts is probably worthless to the business and maybe even destructive, unless they are associated with a actual set of Business Goals or Measurements and they are linked directly with understandable Business deliverables. This is my way of saying put this information in an organized set of spreadsheets linking business metrics, required fields and the order you analyze them and follow a proven process to document them and provide deliverables for both the business and technical needs.
When I say linking I mean creating an “information value chain” relating Business Goals :to Business Questions and breaking them down(decomposing) them into the following:
The methodology for building the information value chain is as follows:
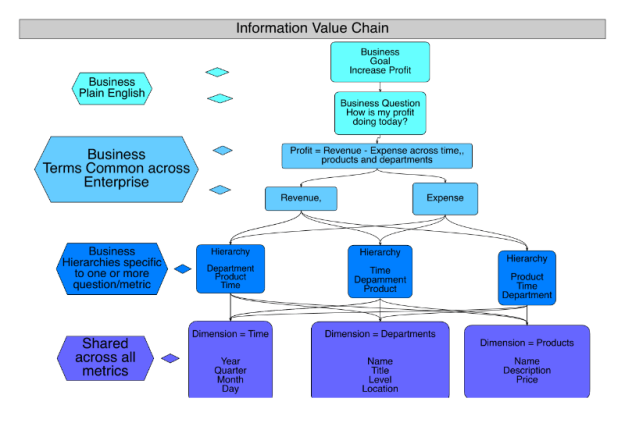
Following this approach as the diagram shows will yield a data model and application architecture that will support answering actual business questions and provide the foundation to continue the path to data governance or to simply hold in place and explore you data to better understand your issues, their impact and then plan and prioritize your next step
Follow the path, pick a “real” goal or measurement , preferably one that matters
After that follow the path in the diagram