#truthtopower
Leave a reply

The primary take away from this article will be that you don’t start your Machine Learning project, MDM , Data Quality or Analytical project with “data” analysis, you start with the end in mind, the business objective in mind. We don’t need to analyze data to know what it is, it’s like oil or water or sand or flour.
Unless we have a business purpose to use these things, we don’t need to analyze them to know what they are. Then because they are only ingredients to whatever we’re trying to make. And what makes them important is to what degree they are part of the recipe , how they are associated

Business Objective: Make Desert
Business Questions: The consensus is Chocolate Cake , how do we make it?
Business Metrics: Baked Chocolate Cake
Metric Decomposition: What are the ingredients and portions?
2/3 cup butter, softened
1-2/3 cups sugar
3 large eggs
2 cups all-purpose flour
2/3 cup baking cocoa
1-1/4 teaspoons baking soda
1 teaspoon salt
1-1/3 cups milk
Confectioners’ sugar or favorite frosting
So here is the point you don’t start to figure out what you’re going to have for dessert by analyzing the quality of the ingredients. It’s not important until you put them in the context of what you’re making and how they relate in essence, or how the ingredients are linked or they are chained together.
In relation to my example of desert and a chocolate cake, an example could be, that you only have one cup of sugar, the eggs could’ve set out on the counter all day, the flour could be coconut flour , etc. etc. you make your judgment on whether not to make the cake on the basis of analyzing all the ingredients in the context of what you want to, which is a chocolate cake made with possibly warm eggs, cocunut flour and only one cup of sugar.
Again belaboring this you don’t start you project by looking at a single entity column or piece of data, until you know what you’re going to use it for in the context of meeting your business objectives.
Applying this to the area of machine learning, data quality and/or MDM lets take an example as follows:
Business Objective: Determine Operating Income
Business Questions: How much do we make, what does it cost us.
Business. Metrics: Operating income = gross income – operating expenses – depreciation – amortization.
Metric Decomposition: What do I need to determine a Operating income?
Gross Income = Sales Amount from Sales Table, Product, Address
Operating Expense = Cost from Expense Table, Department, Vendor
Etc…
Dimensions to Analyze for quality.
Product
Address
Department
Vendor
You may think these are the ingredients for our chocolate cake in regards to business and operating income however we’re missing one key component, the portions or relationship, in business, this would mean the association,hierarchy or drill path that the business will follow when asking a question such as why is our operating income low?
For instance the CEO might first ask what area of the country are we making the least amount of money?
After that the CEO may ask well in that part of the country, what product is making the least amount of money and who manages it, what about the parts suppliers?
Product => Address => Department => Vendor
Product => Department => Vendor => Address
Many times these hierarchies, drill downs, associations or relationships are based on various legal transaction of related data elements the company requires either between their customers and or vendors.
The point here is we need to know the relationships , dependencies and associations that are required for each business legal transaction we’re going to have to build in order to link these elements directly to the metrics that are required for determining operating income, and subsequently answering questions about it.
No matter the project, whether we are preparing for developing a machine learning model, building an MDM application or providing an analytical application if we cannot provide these elements and their associations to a metric , we will not have answered the key business questions and will most likely fail.
The need to resolve the relationships is what drives the need for data quality which is really a way of understanding what you need to do to standardize your data. Because the only way to create the relationships is with standards and mappings between entities.
The key is mastering and linking relationships or associations required for answering business questions, it is certainly not just mastering “data” with out context.
We need MASTER DATA RELATIONSHIP MANAGEMENT
not
MASTER DATA MANAGEMENT.
So final thoughts are the key to making the chocolate cake is understanding the relationships and the relative importance of the data/ingredients to each other not the individual quality of each ingredient.
This also affects the workflow, Many inexperienced MDM Data architects do not realize that these associations form the basis for the fact tables in the analytical area. These associations will be the primary path(work flow) the data stewards will follow in performing maintenance , the stewards will be guided based on these associations to maintain the surrounding dimensions/master entities. Unfortunately instead some architects will focus on the technology and not the business. Virtually all MDM tools are model driven APIs and rely on these relationships(hierarchies) to generate work flow and maintenance screen generation. Many inexperienced architects focus on MVP(Minimal Viable Product), or technical short term deliverable and are quickly called to task due to the fact the incurred cost for the business is not lowered as well as the final product(Chocolate Cake) is delayed and will now cost more.
Unless the specifics of questionable quality in a specific entity or table or understood in the context of the greater business question and association it cannot be excluded are included.
An excellent resource for understanding this context can we found by following: John Owens
Final , final thoughts, there is an emphasis on creating the MVP(Minimal Viable Product) in projects today, my take is in the real world you need to deliver the chocolate cake, simply delivering the cake with no frosting will not do,in reality the client wants to “have their cake and eat it too”.

Note:
Operating Income is a synonym for earnings before interest and taxes (EBIT) and is also referred to as “operating profit” or “recurring profit.” Operating income is calculated as: Operating income = gross income – operating expenses – depreciation – amortization.

DNA and the concept of MDM( Master Data Management) or Modern ML/AI Data Preparation have many similarities.
“There is a subtle difference between data and information.”
We in IT have complicated and diluted the concept and process of analyzing data and business metrics incredibly in the last few decades. We seem to be focus in on the word data.
And if you consider the primary business objectives of MDM is provide consistent answers with standard business definitions and an understanding of the relationship or mappings of business outcomes to data elements.
DNA vs MDM or IT’s version of DNA.
The graphic I’ve chosen for this post symbolizes the linkage or lineage of human beings to DNA. What I’d like to do is relate the importance of lineage of data to examples of human how DNA communicate lineage and then discuss it in our IT as it relates to business functionality
Living Organisms are very complex as is a company and its data or information.
The genetic information of every living organism is stored inside these nucleic the basic data.
There are two types of nucleic acids(NA) namely:
DNA– Defines Traits, Characteristics
RNA – Communication, transfers information and synthesis.
Lets examine them.
DNA- Defines Traits, Characteristics

DNA-Deoxyribonucleic acid – In most living organisms (except for viruses), genetic information is stored in the form of DNA.
RNA – Communication, transfers information and synthesis
.

RNA – can move around in the cells of living organisms and serves as a genetic messenger, passing the information stored in the cell’s DNA from the nucleus to other parts of the cell for protein synthesis.
So here goes this is a bit of a stretch but if you consider DNA is the “Data” and a person the “Information” is created from the communication through the RNA.
To continue the analogy the DNA or chromosomes in and by themselves are out of context. It’s only once they been passed from one person to the next driven by RNA and result in a human being in that they become contextually realized as a human.
Again if we break down human DNA and inspected it, we can tell many things origin, or ancestory , traits of the person possible, diseases of the person, but it needs to be processed for us to understand the actual person.
So my point in relation to various approaches to traditional MDM or Master Data Management yis that this(DNA) is how life is created, it’s science, it’s not a methodology or product in approach a vendor guess work it’s real and the main point is “lineage” is the key
“There is a subtle difference between data and information. Data are the facts or details from which is derived. Individual pieces of data are rarely useful alone. For data to become information, data needs to be put into context.”
Examples of Data and Information as it relates to MDM
The history of temperature readings all over the world for the past 100 years is data.
If this data is organized and analyzed to find that global temperature is rising, then that is information.
“Mislesading” Data”
Data needs to be interpreted and analyzed, it is quite possible — indeed, very probable — that it will be interpreted incorrectly.
When this leads to erroneous conclusions, it is said that the data are misleading. Often this is the result of incomplete data or a lack of context.
For example, your investment in a mutual fund may be up by 5% and you may conclude that the fund managers are doing a great job. However, this could be misleading if the major stock market indices are up by 12%. In this case, the fund has underperformed the market significantly.
Comparison charts

“Synthesis: the combining of the constituent elements of separate material or abstract entities into a single or unified entity ( opposed to analysis, ) the separating of any material or abstract entity into its constituent elements.”
Synthesis in MDM
Communication, transfers information and synthesis, like RNA several companies are prevelant in terms of data movement and replication, in essence data logistics
Defines Traits, Characteristics like DNA many companies have developed and refined products and the techniques required for during these. They are data profiling , domain pattern profiling and record linkage, the basis of transforming data into information .
However lineage is the key, and without this to serve as a connection between data and information, in essence there is no information. And in this case the “information” is the business term from the business glossary.
The integration of data movement capability and the linking of data profiling capabilities can result in providing a business the capabilities answering business question with certitude through the transparency of lineage.
To translate this into “business terms” it’s very similar to providing an audit trail in that a business can ask this questions like what customers are the most profitable look at those customers and then drill into wood products what areas with those profits coming
What lineage accomplishes is to lay a trail of cookie crumbs for data movement but for your business questions, it’s simply makes sure that you can connect the dots as data gets moved and/or translated and/or standardize and or cleansed throughout your enterprise.
And with the simple action of linking data file metadata of files, columns , profiling results to a businesses glossary or business terms, will result in deeply insightful and informative business insight and analysis.
“Analysis the separating of any material or abstract entity into its constituent elements”
In order for a business manager for analyze you need to be able to start the analysis at a understandable business terminology level. And then provide the manager with the ability to decompose or understand lineage from a logical perspective.
There are three essential capabilities required for analysis and utilizing lineage to answer business questions via a meta-data mart and these are very similar to the pattern that exist in DNA.
1. Data profiling and domain(column) analysis as well as fuzzy matching processes that are available in many forms:
a. – Scan all the values within each column and provide statistics(counts) such as minimum value, maximin value, mode(most occuring) value, number of missing value etc…
b. Frequency or Column value Patterns – determine the counts of distinct values within a column and also identify the distinct pattern occurring for all values within a single column and associated counts ie(SSN = 123-45-6789 , SSN PATTERN = ‘999-99-9999’
c. Fuzzy Matching( similarity algorithms) – This capability enables the find the counts of duplicate or similar text values.
2. The results need to be stored is a “Metadata-mart” in order to see the patterns, results and associations providing lineage and retatingraw data to business terms and hierarchies.
3. Visualization and analysis capability to allow for analysis, drill down into data mart aggregated and statistical contents and associated business hierarchies and businessterminology
Underlying each of these analytical capabilities is a set of refined processes, developed and proven code for accomplishing these basic fundamental task.
In future post I will describe how to implement these capabilities with or without vendor products, from a logical perspective.
References:
http://www.diffen.com/difference/Data_vs_Information
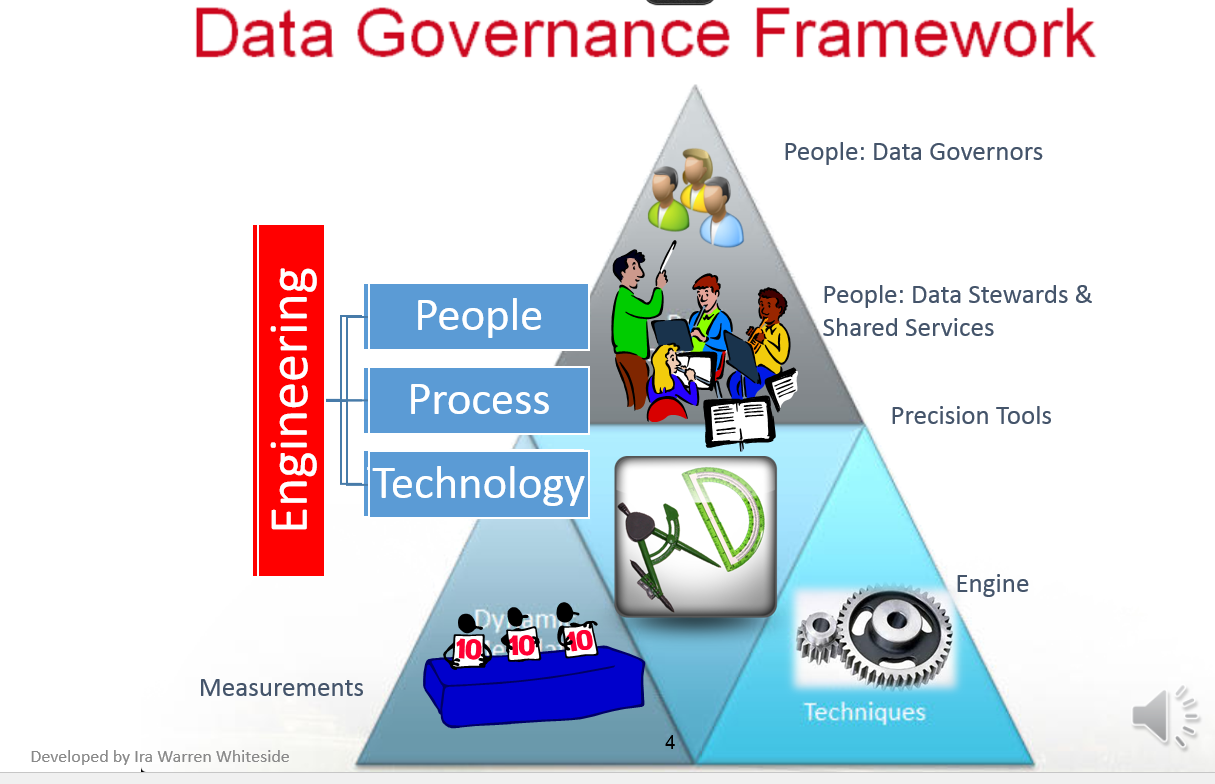
We will explore a methodology for understanding and implementing Data Governance that relies on an ground up approach described by Michael Belcher from Gartner as using ETL and Data Warehouse techniques to build a metadata mart, in order to “boot strap” a Data Governance” effort.
We will discuss the difference between the communication required for data governance and the engineering approach to implementing the “precision” required for MDM, via Data Profiling.
With Data Governance can apply the age old management adage “You get what you inspect, not what you expect” Readers Digest.
We will describe how to implement a data quality dashboard in Excel and how it supports a Data Governance effort in terms of inspection.
Future videos will explore how to build metadata repository as well as the TSQL required to load and update the repository and the data model as well as column and table relationship analysis using the Domain profiling results.
In reading a few recent blog post on centralized data quality vs. distributed data quality have provoked me to offer another point of view.
Organic distributed data quality provides todays awareness for all current source analysis and problem resolution and they are accomplished manually by individuals in most cases.
In many cases when management or leadership(Folks worried about their jobs) are presented with any type of organized machine based data quality results that can easily be viewed, understood and is permanently available, the usual result is to kill or discredit the messenger.
Automated “Data Quality Scoring” (Profiling + Metadata Mart) brings them from a general “awareness” to a realized state “awarement”.
Awarement is the established form of awareness. Once one has accomplished their sense of awareness they have come to terms with awarement.
It’s one thing to know that alcohol can get you drunk, it quite another to be aware that you are drunk when you are drunk.

Perception = Perception
Awarement = Reality
Departmentral DQ = Awareness
vs
Centralized DQ = Awarement
Share the love… of Data Quality– A distributed approach to Data Quality may result in better data outcomes
Implementing a Metadata Mart the Road to Data Governance best viewed in PRESENTATION Mode, there is animation.

This presentation has narrative, play in presentation mode with sound on.
 We want to build an Enterprise Analytical capability by integrating the concepts for building a Metadata Mart with the facilities for the Semantic Web
I have spent some time in this for quite a while now and I believe there is a quite a bit of merit in approaching the collection of domain data and column profile data, in regards to the meta-data mart, and organize them in a triple’s fashion
The basis for JSON-LD and RDFa is the collection of data as a triple. Delving into said deeper
I believe with the proper mapping for the object reference and deriving of the appropriate predicates in the collection of the value we could gain some of the same benefits as well as bringing the web data being “collected, there by linking to source data.
Consider the following excerpt regarding Vocabularies derived from MetaContent via Metadata Structure
“Metadata structures[edit]
Metadata (metacontent), or more correctly, the vocabularies used to assemble metadata (metacontent) statements, are typically structured according to a standardized concept using a well-defined metadata scheme, including: metadata standards and metadata models. Tools such as controlled vocabularies, taxonomies, thesauri, data dictionaries, and metadata registries can be used to apply further standardization to the metadata. Structural metadata commonality is also of paramount importance in data model development and in database design.
Metadata syntax[edit]
Metadata (metacontent) syntax refers to the rules created to structure the fields or elements of metadata (metacontent).[11] A single metadata scheme may be expressed in a number of different markup or programming languages, each of which requires a different syntax. For example, Dublin Core may be expressed in plain text, HTML, XML, and RDF.[12]
A common example of (guide) metacontent is the bibliographic classification, the subject, the Dewey Decimal class number. There is always an implied statement in any “classification” of some object. To classify an object as, for example, Dewey class number 514 (Topology) (i.e. books having the number 514 on their spine) the implied statement is: “<book><subject heading><514>. This is a subject-predicate-object triple, or more importantly, a class-attribute-value triple. The first two elements of the triple (class, attribute) are pieces of some structural metadata having a defined semantic. The third element is a value, preferably from some controlled vocabulary, some reference (master) data. The combination of the metadata and master data elements results in a statement which is a metacontent statement i.e. “metacontent = metadata + master data”. All these elements can be thought of as “vocabulary”. Both metadata and master data are vocabularies which can be assembled into metacontent statements. “
The MetadataMart serve as the source for both metadata vocabulary and MDM for the Master Data Vocabulary.
For the Master Data Vocabulary consider schema.org which defines most of the schemas we need. Consider the following schema.org Persons Properties of Objects and Predicates:
A person (alive, dead, undead, or fictional).
| Property | Expected Type | Description |
| Properties from Person | ||
| additionalName | Text | An additional name for a Person, can be used for a middle name. |
| address | PostalAddress | Physical address of the item. |
The key is to link source data in the Enterprise via a Business Vocabulary from MDM to the Source Data Metadata Vocabulary from a Metadata Mart to conform the triples collected internally and externally.
In essence information from the web applications can be integrated with the dimensional metadata mart, MDM Model and existing Data Warehouses providing lineage for selected raw data from web to Enterprise conformed Dimensions that have gone thru Data Quality processes.
Please let me know your thoughts.
Understanding and mastering the various Microsoft SQL Server Tools available for Data Quality , Master Data Management , Fuzzy Matching and Enterprise Information Management can be daunting and exasperating. In the hopes of reducing the anxiety and frustration I am providing a practical roadmap using openly available resources and requiring only a few days to complete.
I have reviewed and organized several articles and blog post that would allow you within a few days to master the skills required to utilize several SQL Server 2012 capabilities mentioned above.
From a business perspective where to be covering the following:
Basic
Master Data Management (MDS)
Data Quality (DQS)
Integration (SSIS)
Advanced
Fuzzy Matching(data Deduplication)
Data Profiling (Source analysis against business rules)
This article will provide overview of the MDS architecture in support of MDM (Master Data Management)
http://nickbarclay.blogspot.com/2009/12/mds-architecture-notes.html
This article will teach you the steps for implementing Microsoft MDS as well as the tasks required to develop and load a Model. Complete all exercises in order. MDS is the tool Microsoft provide to support creating and maintaining reference data set (Lookup and Code tables) in support of Master Data Management.
http://nickbarclay.blogspot.com/2009/11/beginning-master-data-services-part-1.html
This next article will teach you how to implement and utilize the Data Quality cleansing and matching capabilities.
http://technet.microsoft.com/en-us/library/jj819782.aspx
This article will teach you the concepts and methodology recommended for Fuzzy Matching or Deduplication, in the context of a well known Record Linkage Methodology.
http://www.sqlservercentral.com/articles/Integration+Services+(SSIS)/71486/
I have also included the next two articles to further explore the code and capabilities to solve complex matching and deduplication efforts
http://www.sqlservercentral.com/articles/Fuzzy+Match/65702/
http://www.sqlservercentral.com/articles/Integration+Services+(SSIS)/65616/
Creating a Metadata Mart via TSQL – Complete Data Profiling Kit – Download
https://irawarrenwhiteside.com/2014/04/13/creating-a-metadata-mart-via-tsql/
Watch “Guerrilla MDS MDM The Road To Data Governance” by @irawhiteside on @PASSBIVC channel here: youtu.be/U0TtQUhch-U #SQLServer #SQLPASS
For tomorrow’s MDM you must be ready to embrace Agile Iterative and/or Extreme Scoping in order to fully realize the benefits and learn the constraints of MDS
With Data Profiling can apply the age old management adage “You get what you inspect, not what you expect” Readers Digest.
This article will describe how to implement a data profiling dashboard in Excel and a metadata repository as well as the TSQL required to load and update the repository.
Future articles will explore the data model as well as column and table relationship analysis using the Domain profiling results.
Data Profiling is essential to properly determine inconsistencies as well data transformation requirements for integration efforts.
It is also important to be able to communicate the general data quality for the datasets or tables you will be processing.
With the assistance over the years of a few friends(Joe Novella, Scott Morgan and Michael Capes) as well as the work of Stephan DeBlois, I have created a set of TSQL Scripts that will create a set of tables that will provide the statistics to present your clients with a Data Quality Scorecard comparable to existing vendor tools such as Informatica , Data Flux , Data Stage and the SSIS Data Profiling Task.
This article contains a Complete Data Profiling Kit – Download (Code, Excel Dashboards and Samples) providing capabilities similar to leading vendor tools, such as Informatica, Data Stage, Dataflux etc…
The primary difference is the repository is open and the code is also open and available and customizable. The profiling process has 4 steps as follows:
Here is a sample of the Column Statistics Dashboard: There are three panels show one worksheet for a sample “Customers” file.
Complete Column Dashboard:


In the example below you see an Excel Worksheet that contains a pivot table allowing you to examine a columns patterns , in this cse Zip code, and subsequently drill into the actual values related to one of the patterns. Notice the Zip code example, we will review the pattern “9999”, or Zip code with only 4 numeric digits. When you click on the pattern og “9999” the actual value is revealed is