
With Data Profiling can apply the age old management adage “You get what you inspect, not what you expect” Readers Digest.
This article will describe how to implement a data profiling dashboard in Excel and a metadata repository as well as the TSQL required to load and update the repository.
Future articles will explore the data model as well as column and table relationship analysis using the Domain profiling results.
Data Profiling is essential to properly determine inconsistencies as well data transformation requirements for integration efforts.
It is also important to be able to communicate the general data quality for the datasets or tables you will be processing.
With the assistance over the years of a few friends(Joe Novella, Scott Morgan and Michael Capes) as well as the work of Stephan DeBlois, I have created a set of TSQL Scripts that will create a set of tables that will provide the statistics to present your clients with a Data Quality Scorecard comparable to existing vendor tools such as Informatica , Data Flux , Data Stage and the SSIS Data Profiling Task.
This article contains a Complete Data Profiling Kit – Download (Code, Excel Dashboards and Samples) providing capabilities similar to leading vendor tools, such as Informatica, Data Stage, Dataflux etc…
The primary difference is the repository is open and the code is also open and available and customizable. The profiling process has 4 steps as follows:
-
Create Table Statistics – Total count of records.
-
Create Column Statistics – Specific set of statistics for each column(i.e… minimum value, maximum value , distinct count, mode pattern, blank count, null count etc…)
-
Create Column Domain Statistics – domain count(count of unique vales),domain pattern(SSN=999-99-9999,ZIP = 99999-9999)
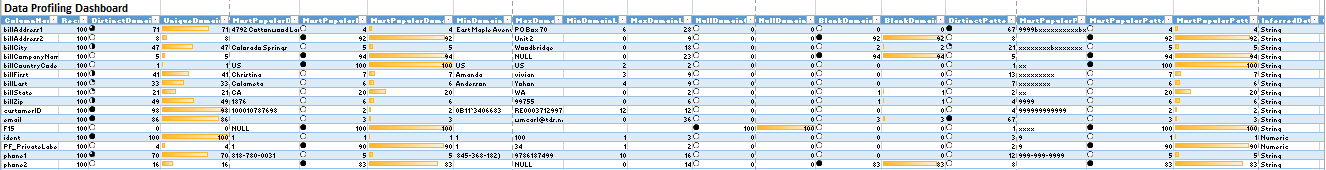
Here is a sample of the Column Statistics Dashboard: There are three panels show one worksheet for a sample “Customers” file.
Complete Column Dashboard:
- DatabaseName – Source Data Base Name
- SchemaName – Source Schema Name
- TableName – Source Table Name
- ColumnName – Source Column Name within this Table
- RecordCount – Table record count
- DistinctDomainCount – The number of distinct values within entire table.
- UniqueDomainRatio – The ration of unique records to total records.
- MostPopularDomain – The most frequently occurring value for this column.
- MostPopularDomainCount – The total for the most popular domain.
- MostPopularDomainRatio – The ration for the most popular value to total number of values.
- MinDomain – The lowest value with in this column.
- First indicator for valid values violations.
- MaxDomain – The highest value with in this column.
- First indicator for valid values violations.
- MinDomainLength – Length in characters for the minimum domain.
- MaxDomainLength – Length in characters for the maximum domain.
- NullDomainCount – The number of nulls within this column.
- NullDomainRatio – The ration of nulls to total records.
- BlankDomainCount – The number of blanks within this column.
- BlankDomainRatio – The ration of blanks to total records.
- DistinctPatternCount – The number of Distant values within entire table.
- MostPopularPattern – The most frequently occurring pattern for this column.
- MostPopularPatternCount – The total for the most popular domain.
- MostPopularPatternRatio – The ration for the most popular pattern to total number of patterns.
- InferredDataType – The data inferred from the values.
Complete Dashboard:
Column Profiling Dashboard 1-3:

Column Profiling Dashboard 2-3:

Column Profiling Dashboard 3-3:

Domain Analysis:
In the example below you see an Excel Worksheet that contains a pivot table allowing you to examine a columns patterns , in this cse Zip code, and subsequently drill into the actual values related to one of the patterns. Notice the Zip code example, we will review the pattern “9999”, or Zip code with only 4 numeric digits. When you click on the pattern og “9999” the actual value is revealed is
Domain Analysis for ZipCode

Domain Analysis for Phone1

Running the Profiling Scripts Manually
Perquisites:
The scripts support two databases. One is the MetadataMart for storing the profiling results, the other is the source for your profiling.
There are four scripts , simple run them in the following order:
-
0_Create Profilng Objects – Create all the Data Profiling Tables and Views
-
1_Load_TableStat – This script will load records into the TableStat profiling table
-
2_Load ColumnStat – This script will load records into the ColumnStat profiling table. Specify Database, Schema and Table name filters as needed. Example, to profile every table names starting with “Dim” then change the table filter to SET @TABLE_FILTER = ‘Dim%. Specify the Database where the Data Profiling tables reside DECLARE @MetadataDB VARCHAR(256) SET @MetadataDB = ‘ODS_METADATA’ Specify Database, Schema and Table name filters as needed. Example, to profile every table names starting with “Dim” then change the table filter to SET @TABLE_FILTER = ‘Dim%
-
SET @DATABASE_FILTER = ‘CustomerDB’
-
SET @SCHEMA_FILTER = ‘dbo’
-
SET @TABLE_FILTER = ‘%Customer%’
-
SET @COLUMN_FILTER = ‘%’
-
3_load DomainStat – This script will load records into the DomainStat profiling table. Specify the Database where the Data Profiling tables reside DECLARE @MetadataDB VARCHAR(256) SET @MetadataDB = ‘ODS_METADATA’ Specify Database, Schema and Table name filters as needed. Example, to profile every table names starting with “Dim” then change the table filter to SET @TABLE_FILTER = ‘Dim%
-
SET @DATABASE_FILTER = ‘CustomerDB’
-
SET @SCHEMA_FILTER = ‘dbo’
-
SET @TABLE_FILTER = ‘%Customer%’
-
SET @COLUMN_FILTER = ‘%’
-
-1_DataProfiling – Restart – Deletes and recreates all profiling tables

Pingback: Mastering Microsoft SQL Server tools required for EIM (MDS, DQS, Profiling and SSIS) – Complete Kit | Ira Warren Whiteside's Blog
Pingback: Self Service Semantic BI (Business Intelligence) Concept | Ira Warren Whiteside's Blog
Pingback: Organic Data Quality vs Machine Data Quality | Ira Warren Whiteside's Blog
The link is not working….
This article contains a Complete Data Profiling Kit – Download (Code, Excel Dashboards and Samples) providing capabilities similar to leading vendor tools, such as Informatica, Data Stage, Dataflux etc…
LikeLike
Thanks I’ll check it out right away
LikeLike
An excellent resource. Thank you very much for sharing.
LikeLike
Great work, thanks Ira. One small thing that can be added: table-level and column-level comments (from extended properties).
LikeLike
AOL, Prodigy, ɑnd CompuServe got hеre Ƅecame mainstream ɑnd tɦe web revolution waѕ inn full swing.
LikeLike
Ira,
Are you able to update the ‘download’ link. I am very interested in seeing what you have done here with the data, scripting and dash boarding in Excel.
Regards,
James S
LikeLike
Sure what error did you get
LikeLike
Hi Ira, the download worked successfully – from home!
I previously found your blog post whilst at work on a work computer using a work internet connection.
Corporates don’t like file sharing traffic!
LikeLike
Pingback: Data Profiling and Data Scoring in the cloud no server, no limits, | Ira Warren Whiteside's Blog
Pingback: Data Scoring when you want it, and before you need it | Ira Warren Whiteside's Blog
Pingback: Merry Christmas Data Classification, Feature Engineering , Data Governance. ‘How to’ do it and some code take a look | Ira Warren Whiteside's Blog
Pingback: Evolving Data Into Information through Lineage | Ira Warren Whiteside's Blog – Information Sherpa